If you are looking for help on how to turn chat answers into Dashboards, read the article Turn Answers into Dashboards.
- Explore the Dashboards Editor
- Arrange Dashboard Layout
- Get Stakeholders Sign-Off
- Export your Dashboard
Explore the Dashboards Editor
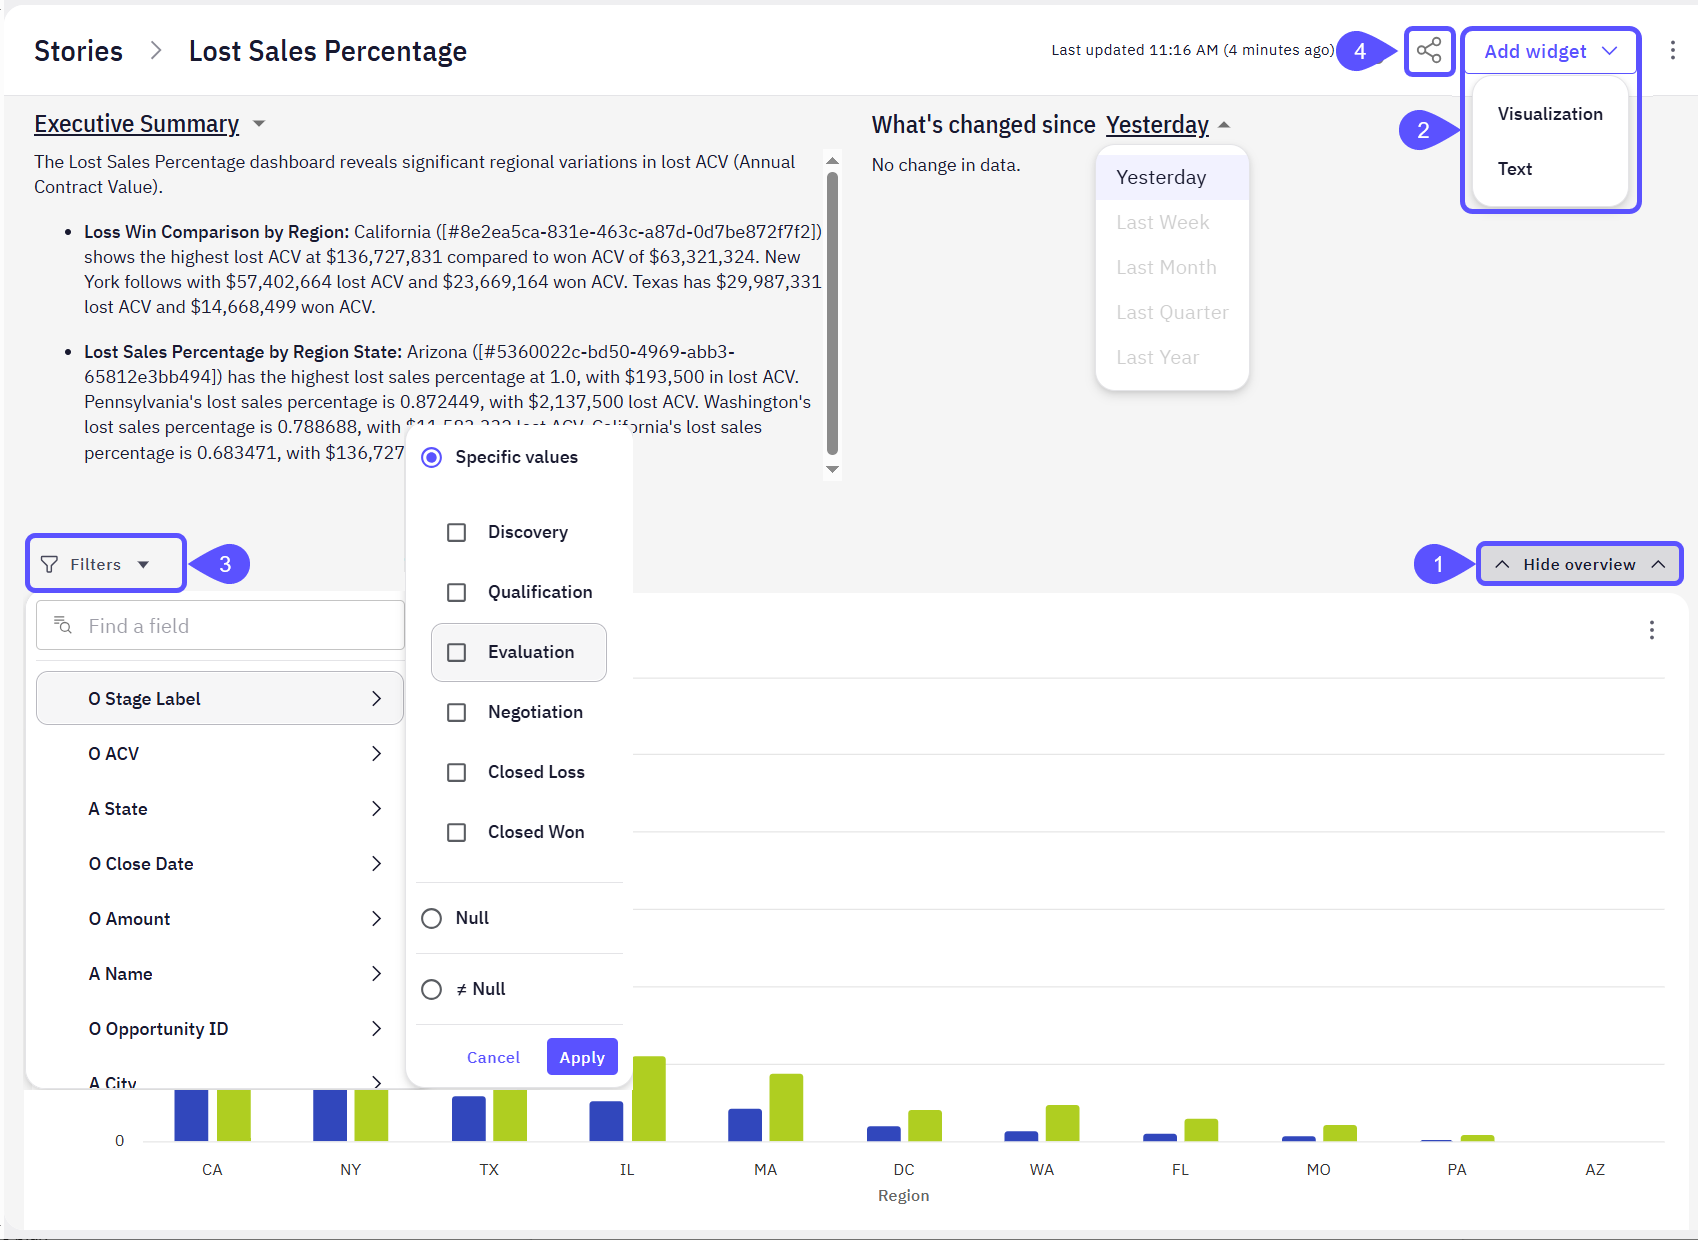
Once your analysis is complete and you have turned answers into cards (see the Turn Answers into Dashboards article), the Dashboards section becomes your central workspace. Here, you can refine the presentation of your insights, build out full dashboards, and prepare content for sharing. The Dashboards Editor includes features such as:- A collapsible Overview section that includes:
- An Executive Summary for setting context at the top of your Dashboard.
- A data summary for what’s changed since a specific date, such as yesterday, last week, etc.
- An option to add a widget directly from the Dashboard interface. Create Visualization or Text widgets that communicate key takeaways.
The Visualization option opens a chat interface that helps you generate visual content based on your data. In contrast, the Text option opens an MDX editor to add narrative or explanatory content.
- A Filters pane for interactive data exploration.
- An option to share your Dashboard effectively.
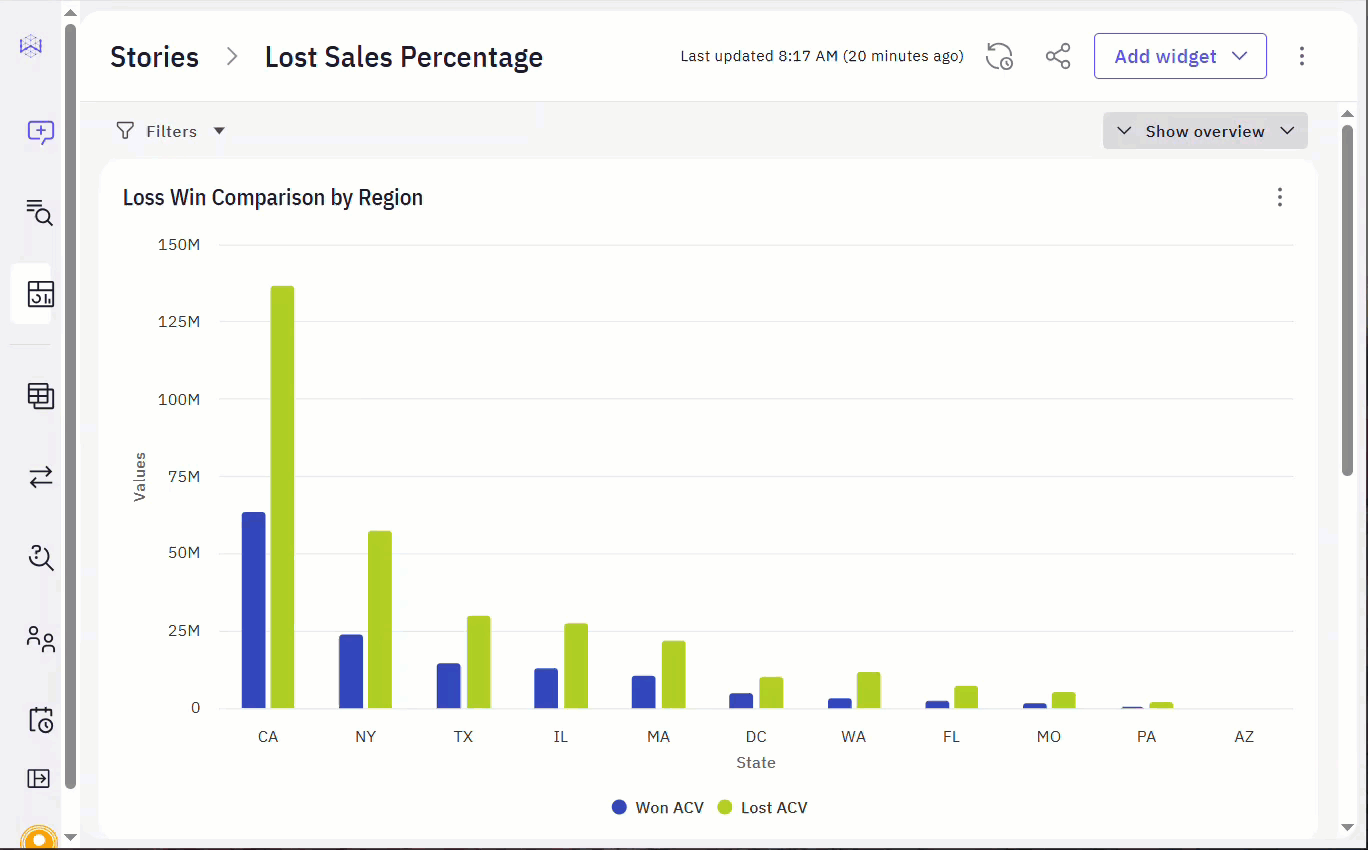
Arrange Dashboard layout
Make your Dashboard both visually compelling and logically structured:- Move Dashboards cards around the workspace to arrange them in order by importance, logical flow, or stakeholder preference.
- Group related cards to create thematic Dashboards (e.g., “Monthly Revenue Trends,” “Top Performing Reps,” “Churn Metrics”).
- Edit the answers to Dashboards cards to emphasize key metrics and insights, ensuring your visuals match the narrative flow.
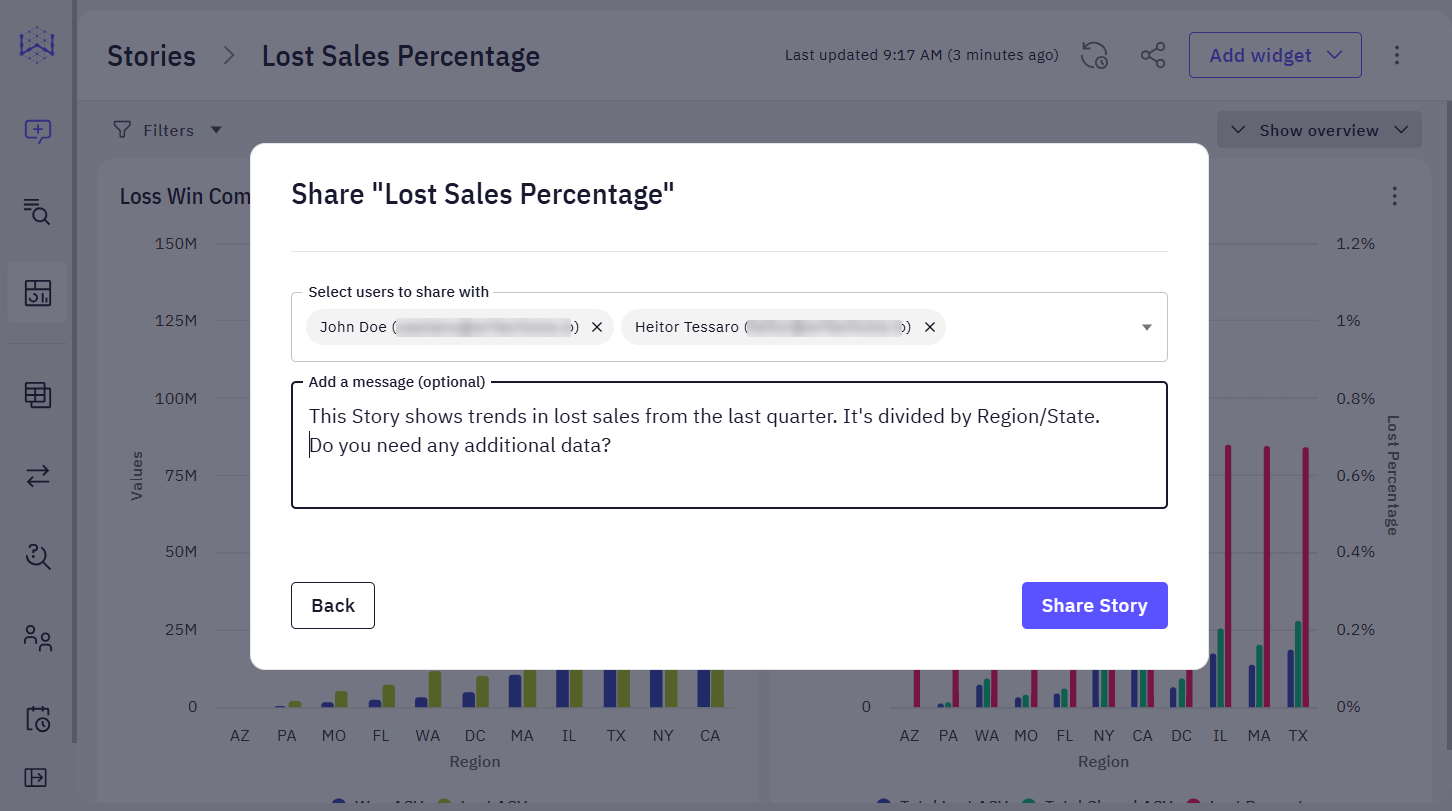
Get stakeholders sign-off
Before finalizing your Dashboard for broader distribution or operational use, it is essential to obtain approval from key stakeholders. This ensures the information is accurate, aligned with business goals, and ready to guide decisions. Here is a suggested flow:- Share the Dashboard link with stakeholders.
- Add context: summarize what the Dashboard includes and the decisions it is intended to support.
- Collect feedback directly within the platform or through async tools (Slack, email).
- Incorporate edits based on feedback, then tag the Dashboard as final or rename it for future iterations.
Export your Dashboard
Once you are satisfied with your layout and stakeholders have approved it, you may want to share it or schedule notifications to keep stakeholders and explorers informed. Both topics are covered in related articles.- To learn how to share your Dashboard and manage access permissions, see the Share Dashboards and Set Access Control article.
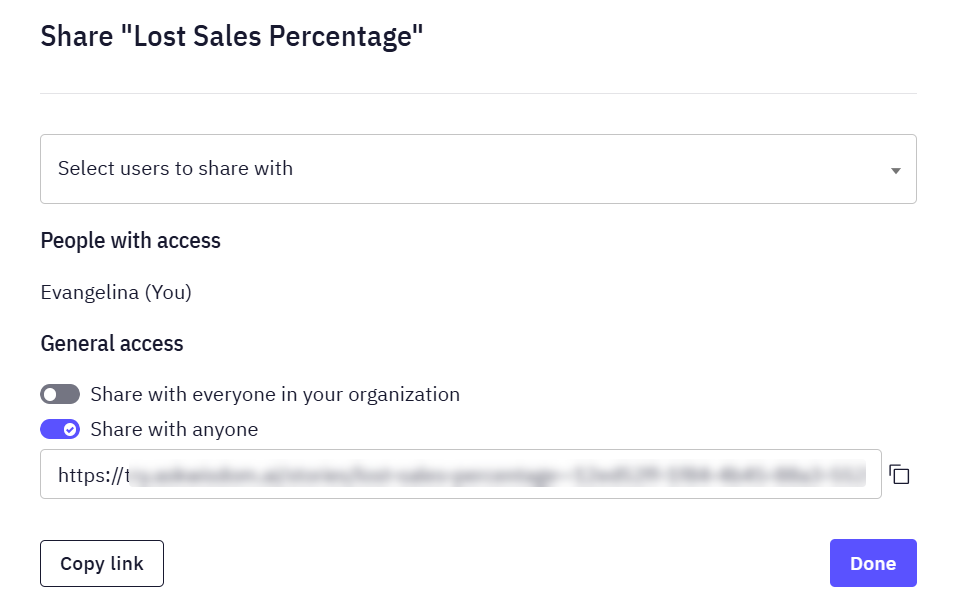
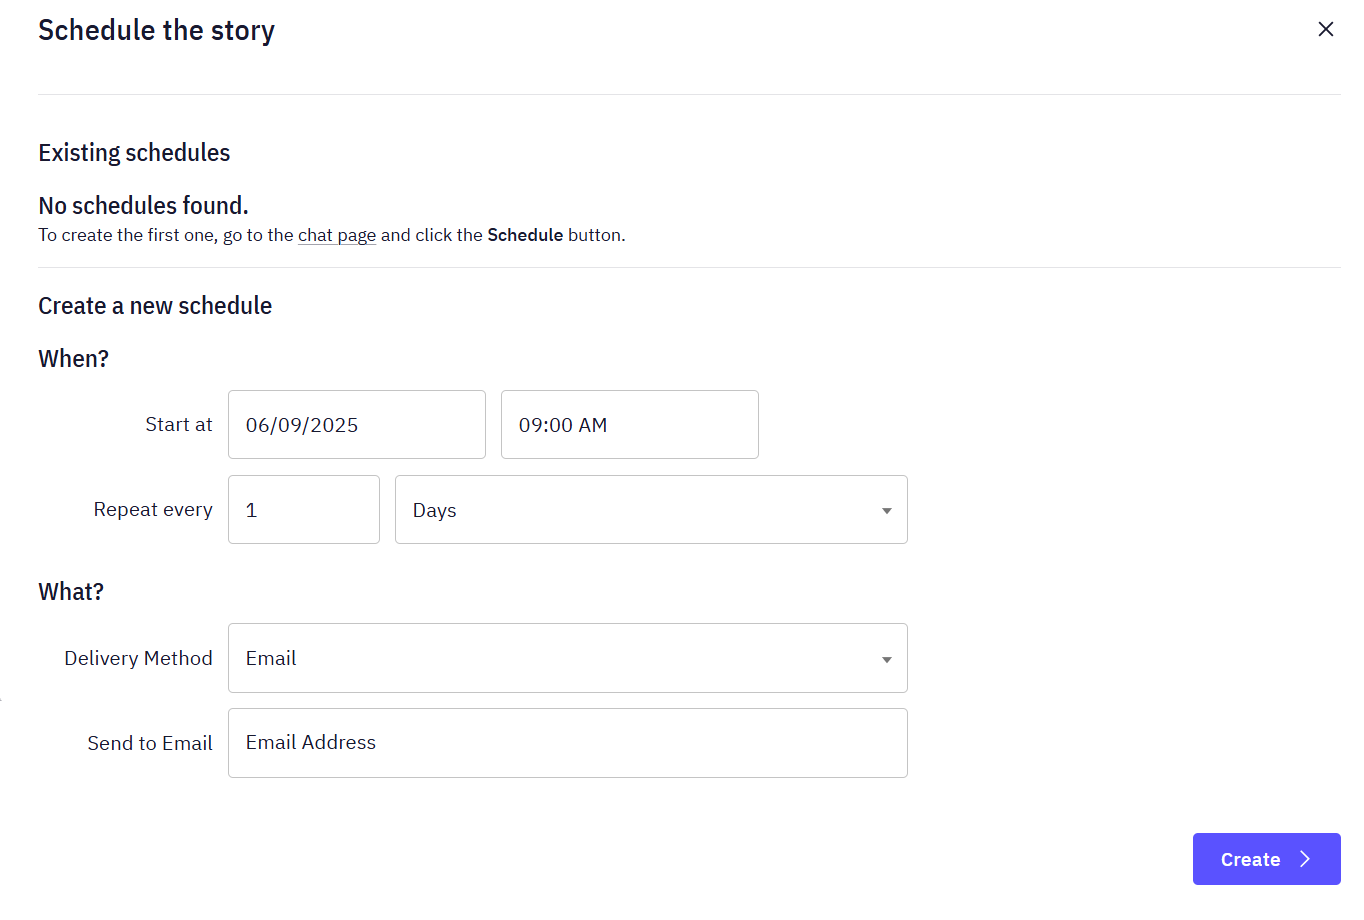
- If you would like to schedule Dashboard updates and receive notifications, check out the Schedule Dashboard Notifications guide.
Next steps
Turn Answers into Dashboards
Compile key insights and visualizations into a shareable, narrative-driven report.
Schedule Dashboard Notifications
Set up automated notifications to keep stakeholders updated with the latest dashboard insights.
Share Dashboards and Set Access Control
Learn how to share your dashboards with others and manage who can view or edit them.