- Create dynamic narratives using your data.
- Customize layouts and visuals from responses to suit your audience.
- Share updates that automatically reflect the changes in your datasets.
Create Dashboards from chat responses
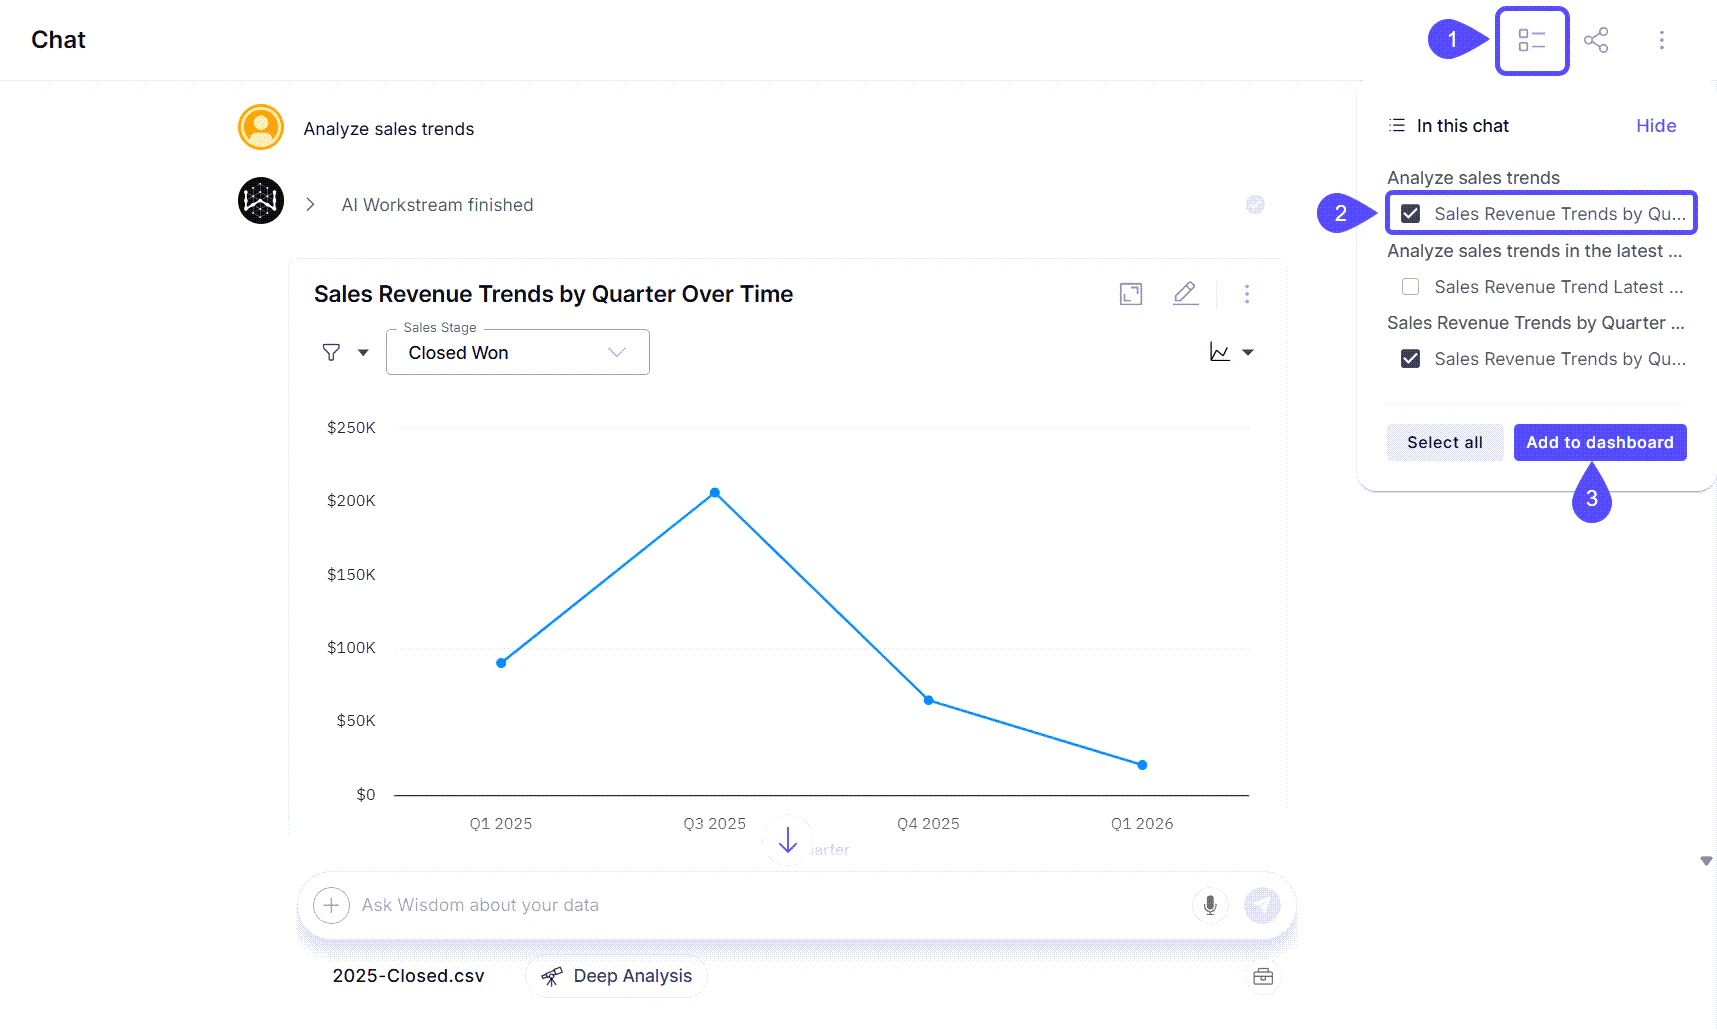
- Within your chat window, click on the contextual menu icon labeled “In this chat.”
- Select one or more answers that you would like to include in your Dashboard.
- Click on Add to dashboard.
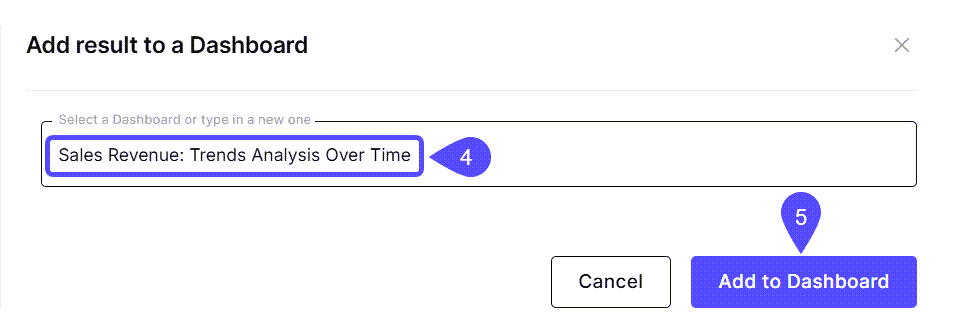
- In the modal window that opens, type the title of the new Dashboard or select an existing one.
- Click the Add to Dashboard button. Now, you can find it under the Dashboards tab in the sidebar to begin sharing insights or scheduling updates.
Create Dashboards from the Editor
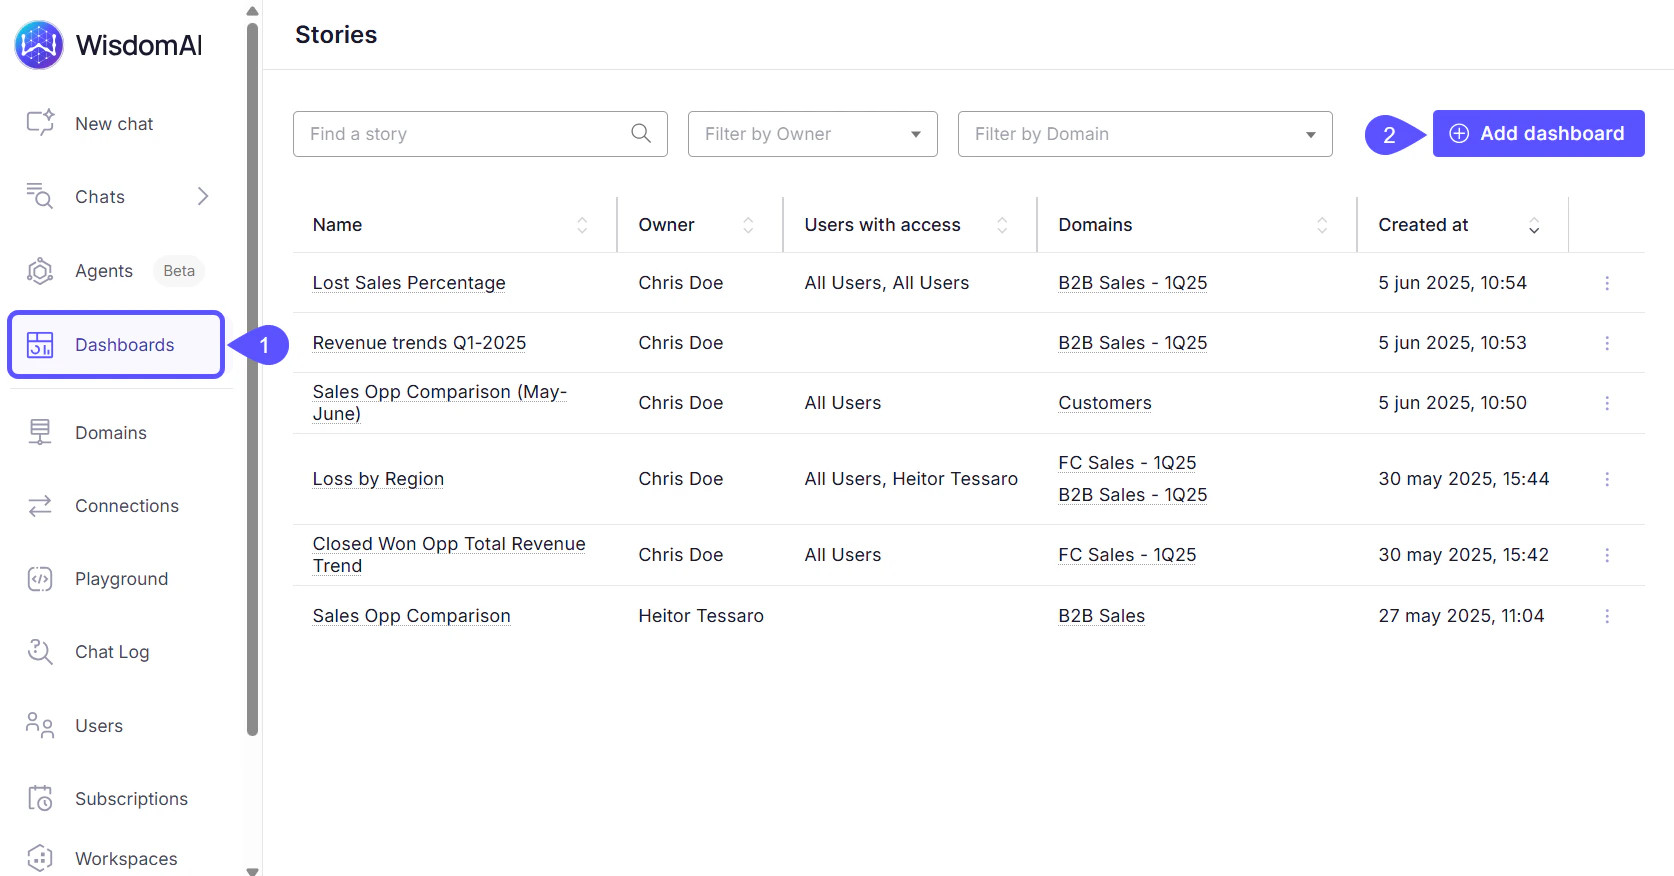
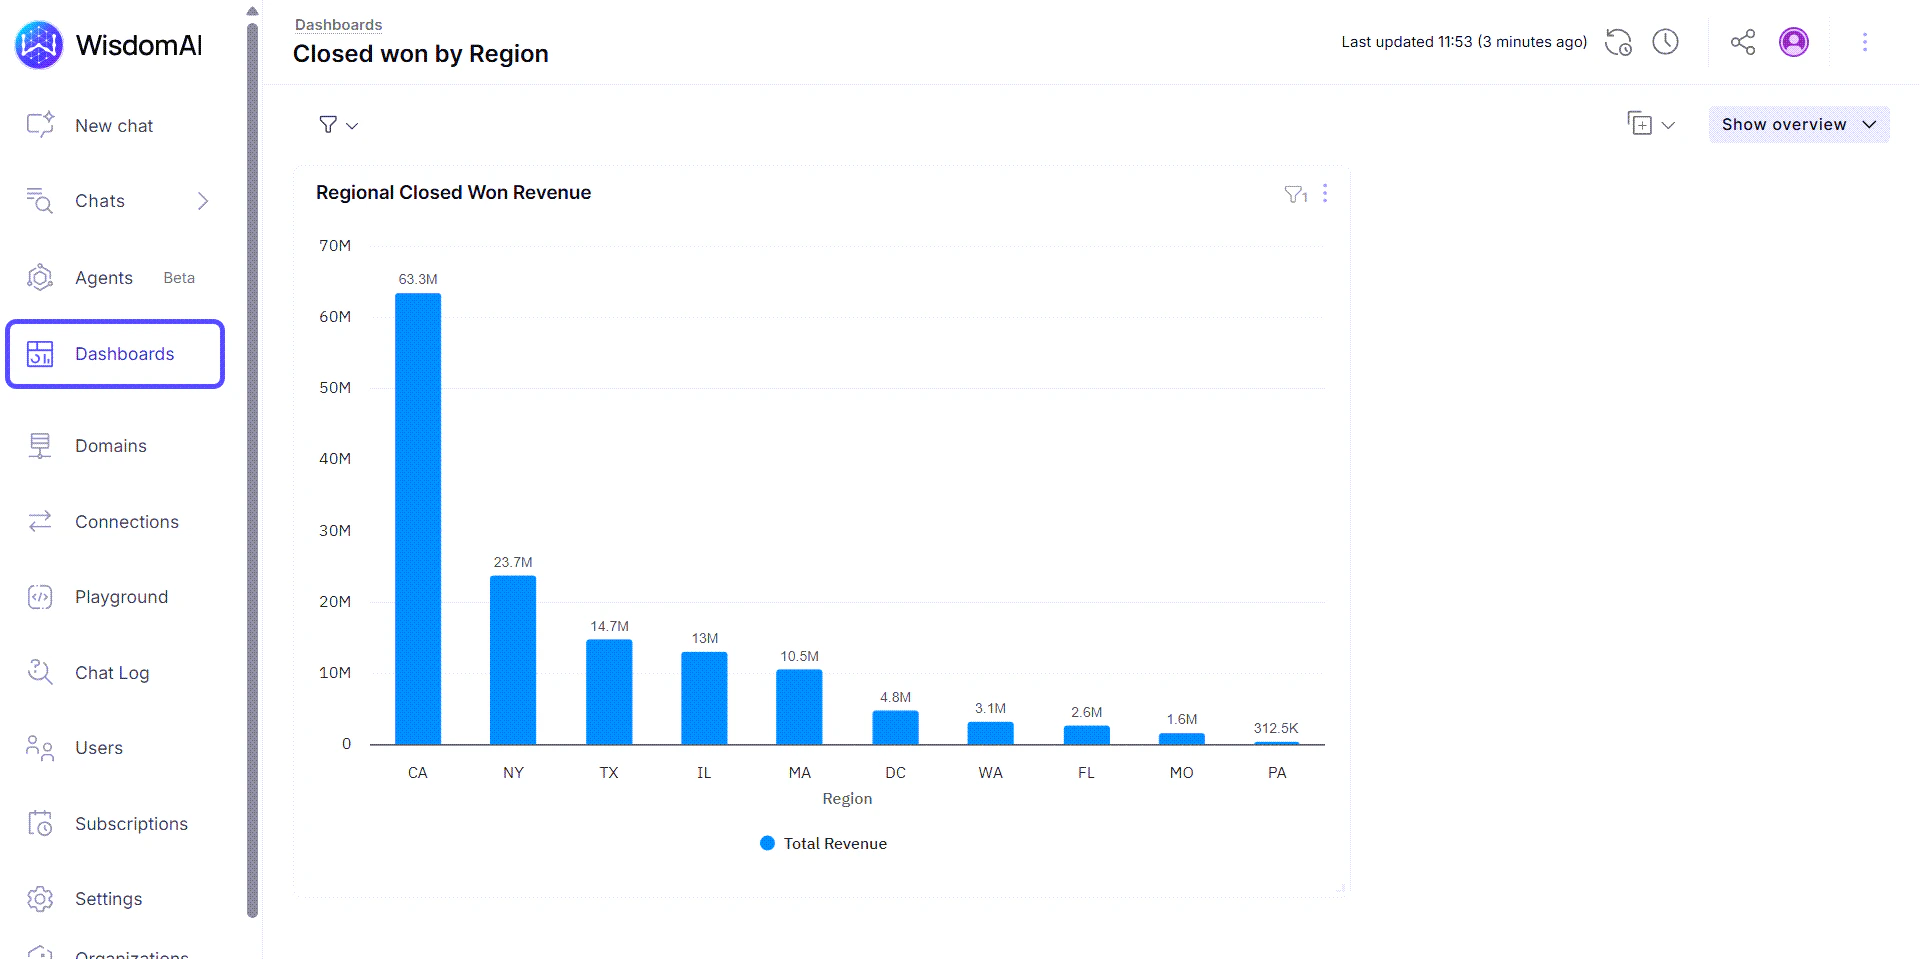
- Open Dashboards in the left sidebar.
- Click on the Add Dashboard button.
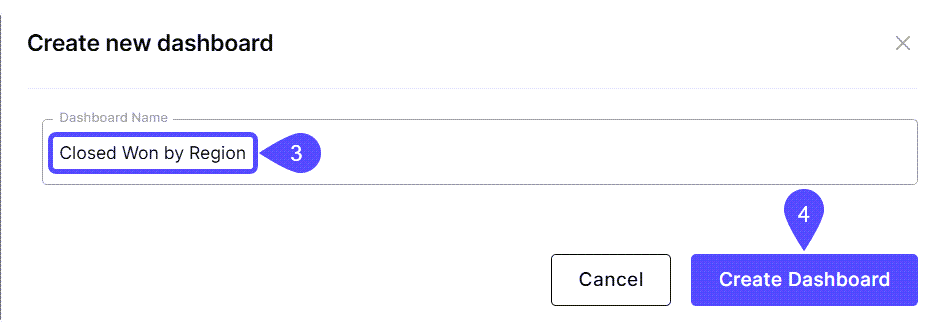
- Add a relevant name to your Dashboard.
- Click on Create Dashboard.
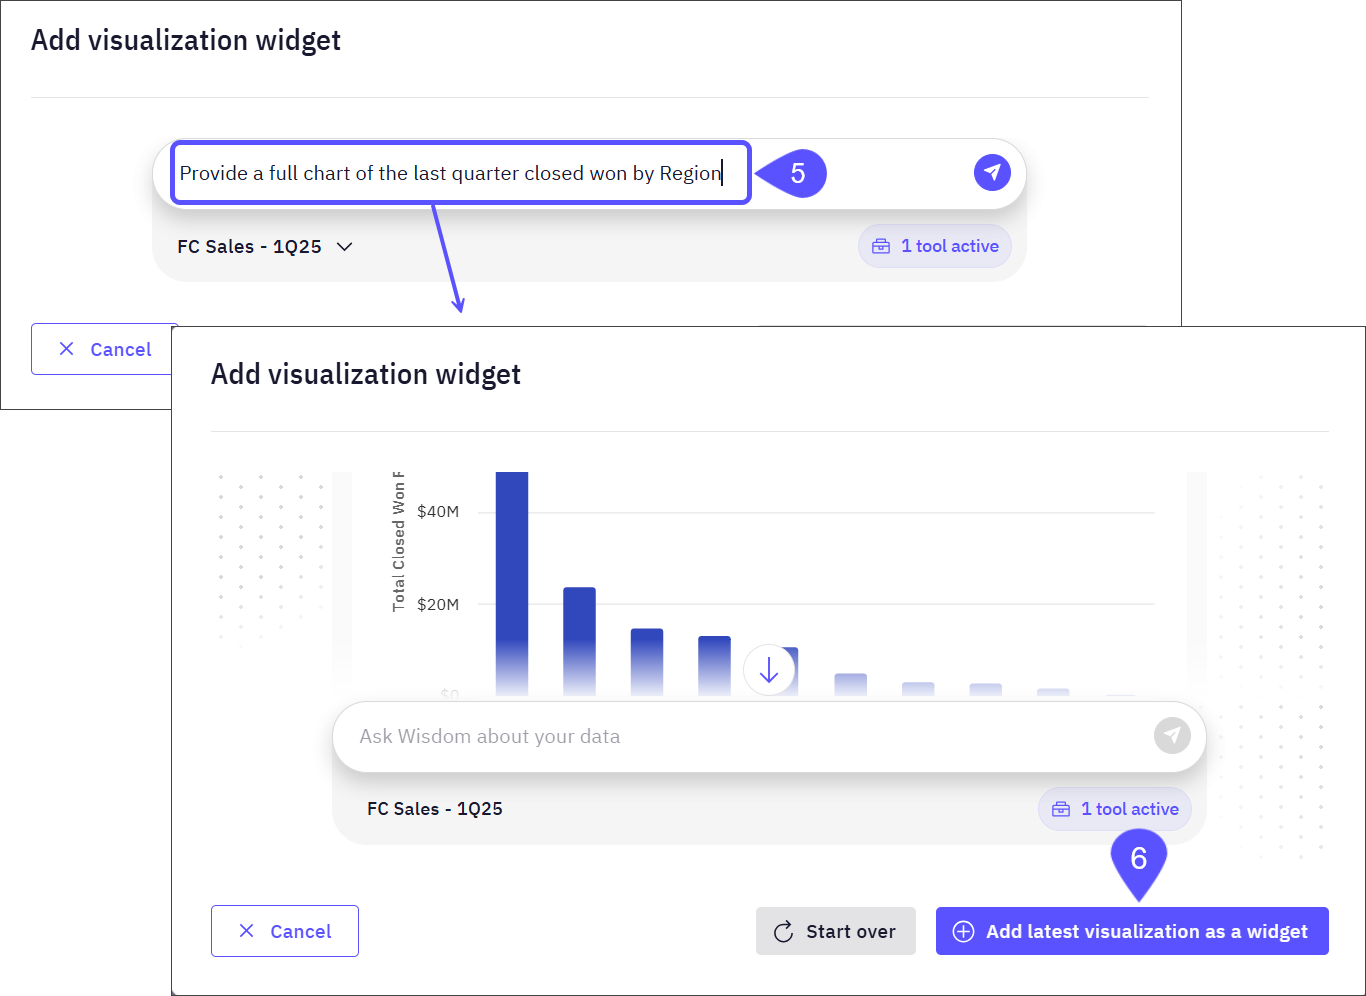
- The Add visualization widget modal window will open. In this window, you can ask WisdomAI a question about your data in natural language. Based on your question and query, WisdomAI may generate a visual representation, such as a chart or graph, that you can review and add directly to the Dashboard.
- Click on the Add latest visualization as a widget button to save the response (a chart in this example) in the Dashboard.
Next steps
Schedule Dashboard Notifications
Set up automated notifications to keep stakeholders updated with the latest dashboard insights.
Share Dashboards and Set Access Control
Learn how to share your dashboards with others and manage who can view or edit them.