

Before you start
To use this feature, make sure you have a dashboard to chat with. If you haven’t created one yet, see Turn Answers into Dashboards or Build Dashboards.Ask a question about your dashboard data
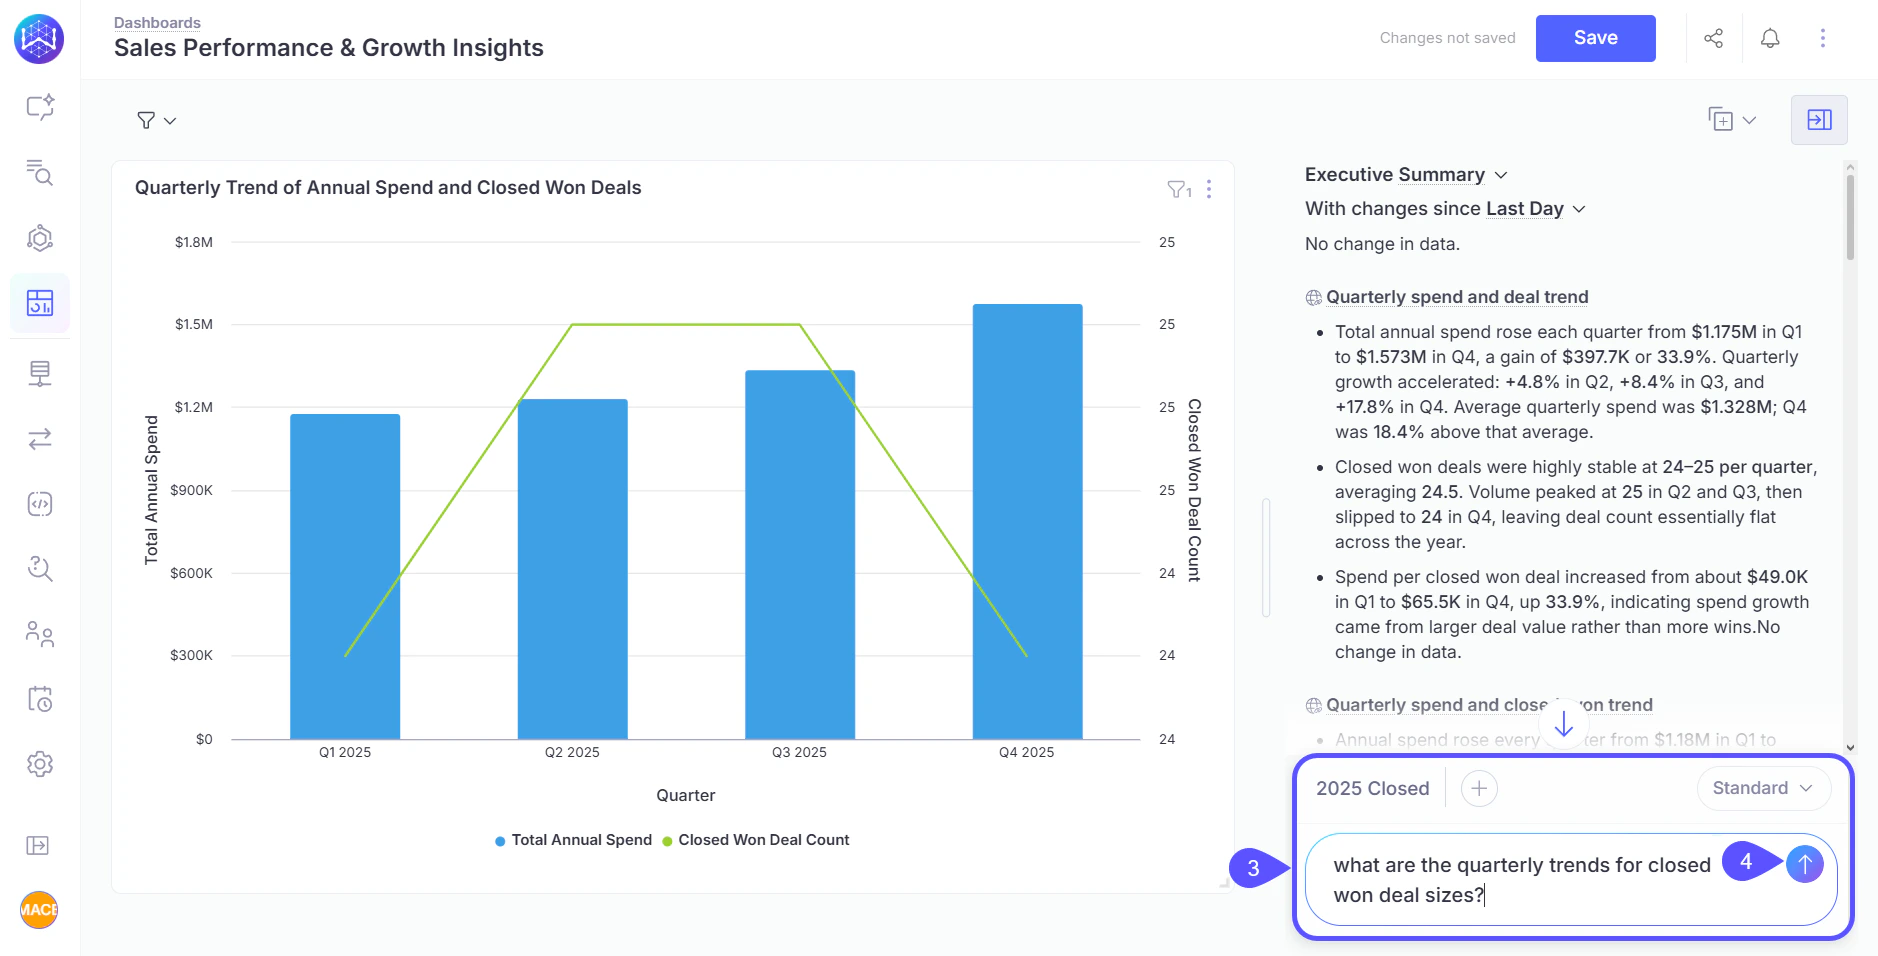
When you open a dashboard, the chat sidebar opens on the right side of the page, and two AI-generated tiles appear at the top:-
Executive Summary: A streaming narrative summary of all data in the current dashboard.
The Executive Summary can be customized to focus on the metrics and dimensions most relevant to you and your team. Use the customization options on the tile to tailor the narrative to your audience.
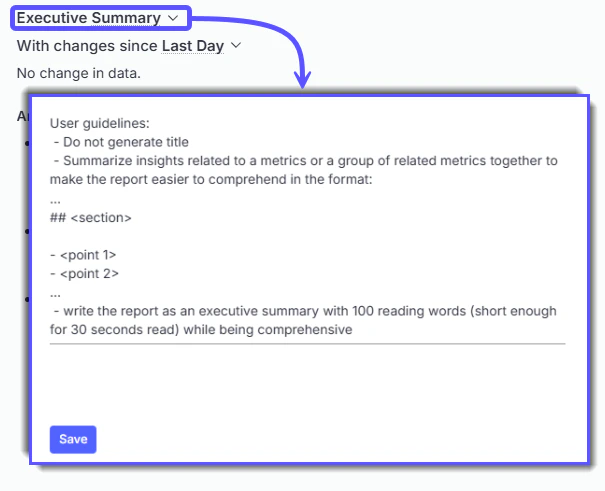
-
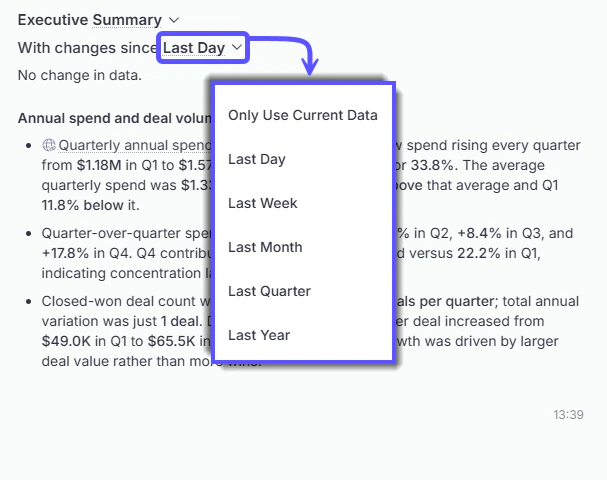
With changes since: A comparison highlighting differences since your last visit or a specific date. You can select what suits you best.
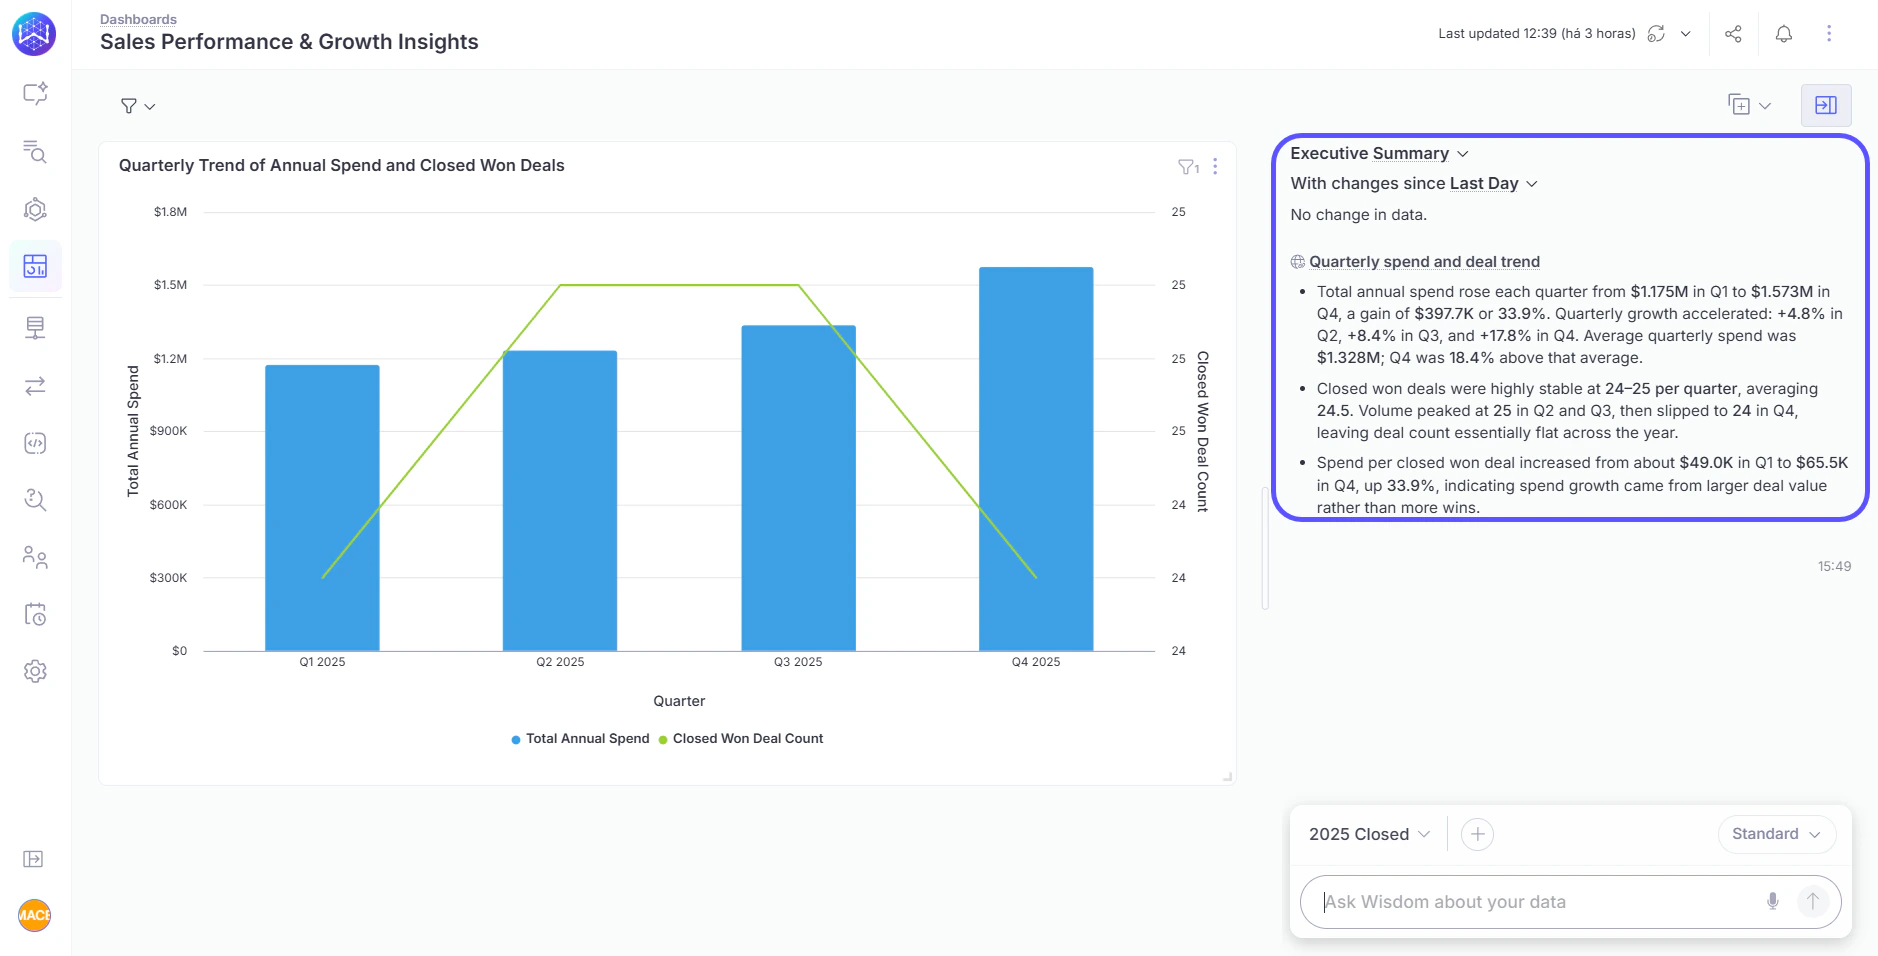
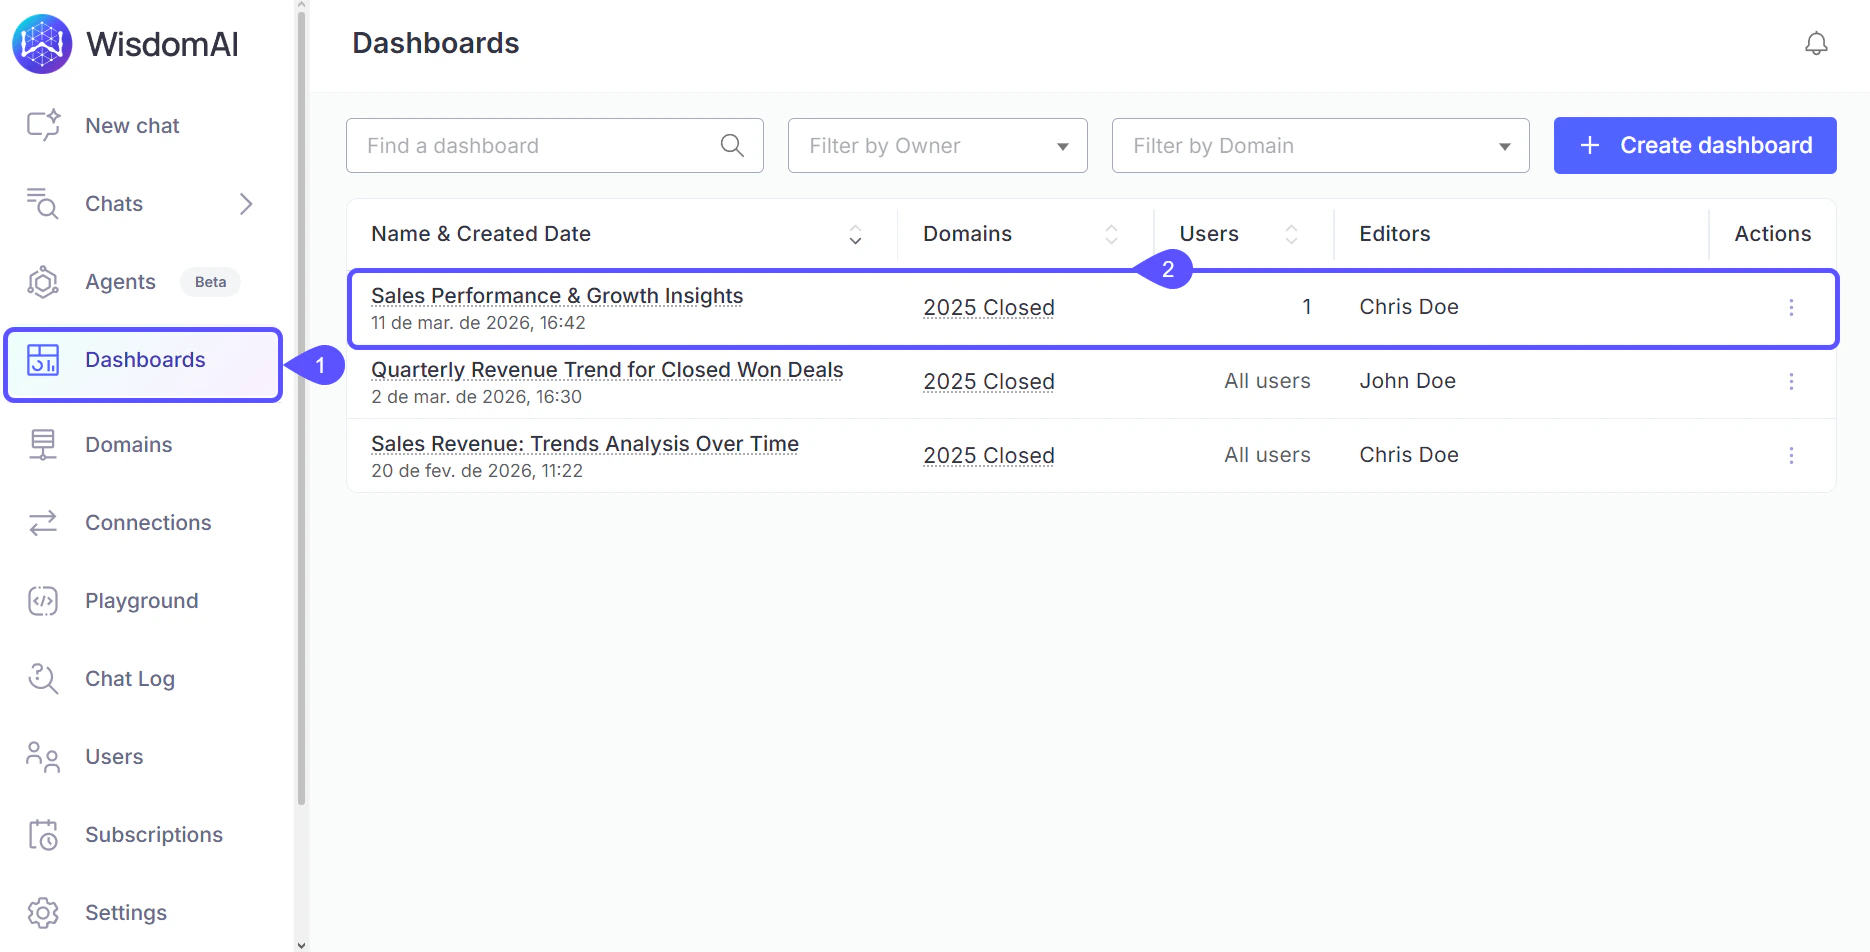
- Click Dashboards on the sidebar.
- Select the dashboard you want to chat with.
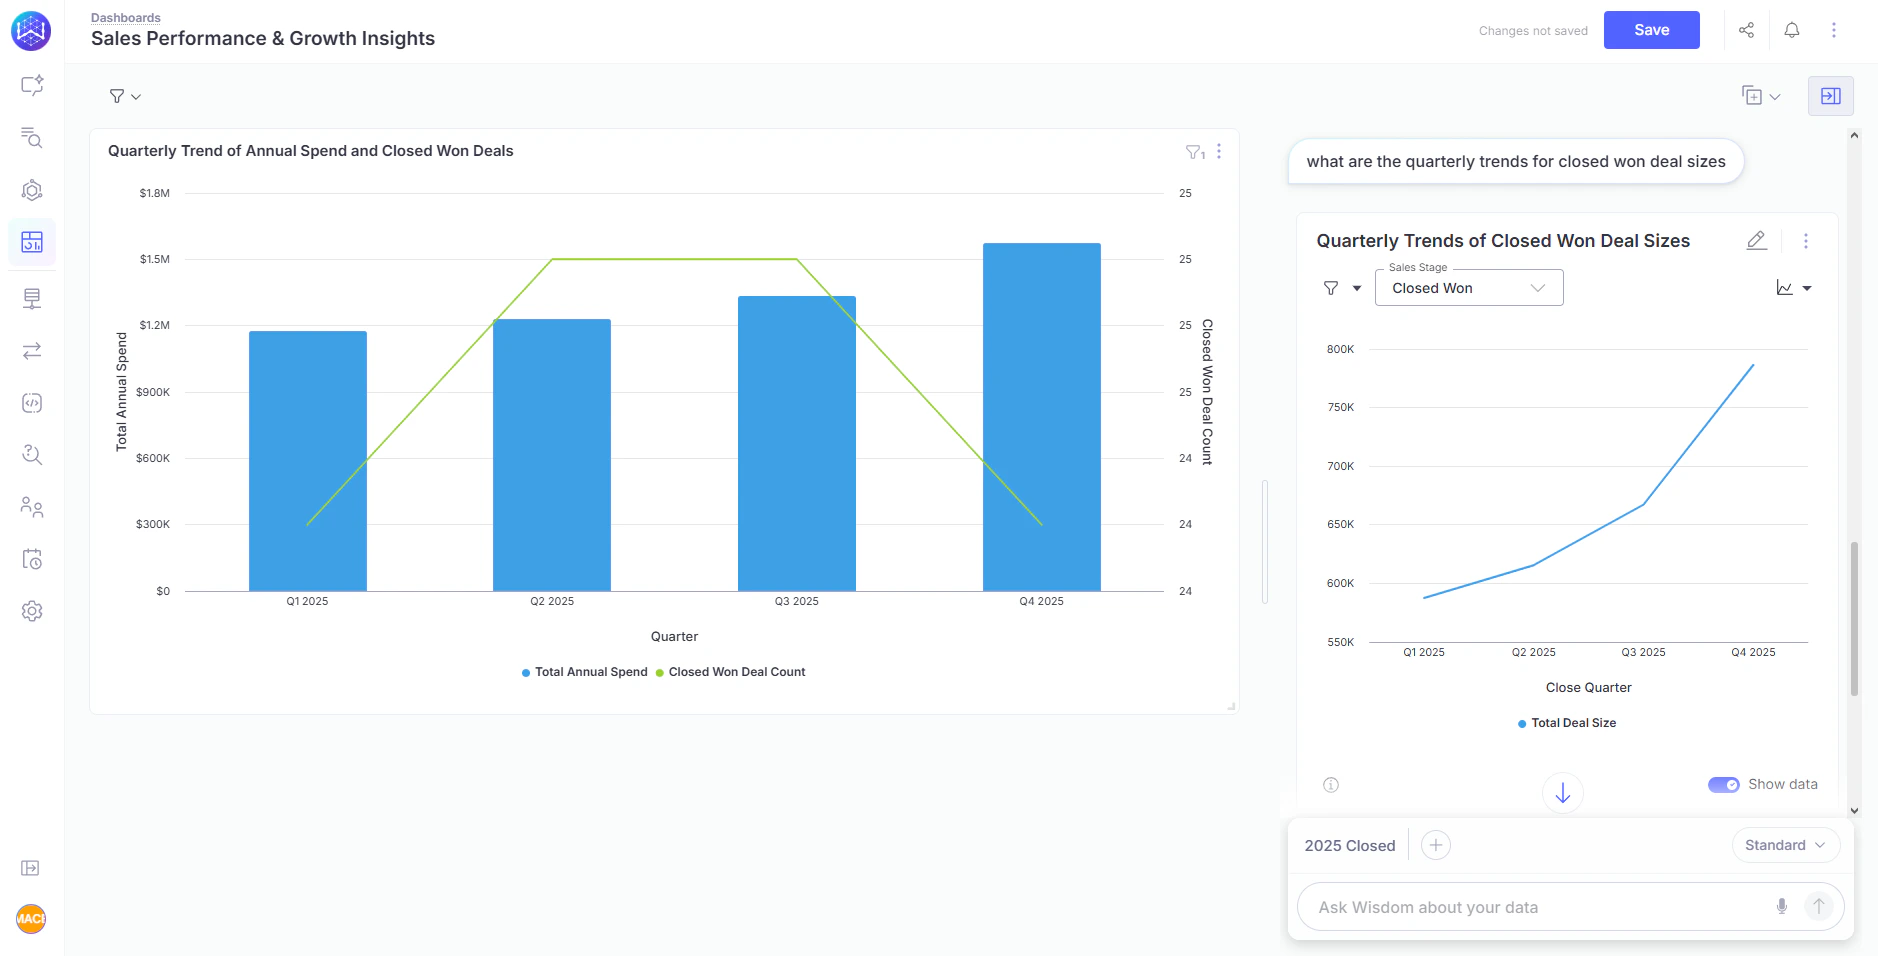
- Click the chat input at the bottom of the sidebar and type a natural-language question about the data shown on the dashboard.
- Press Enter or click the send button.
Add tiles to the dashboard
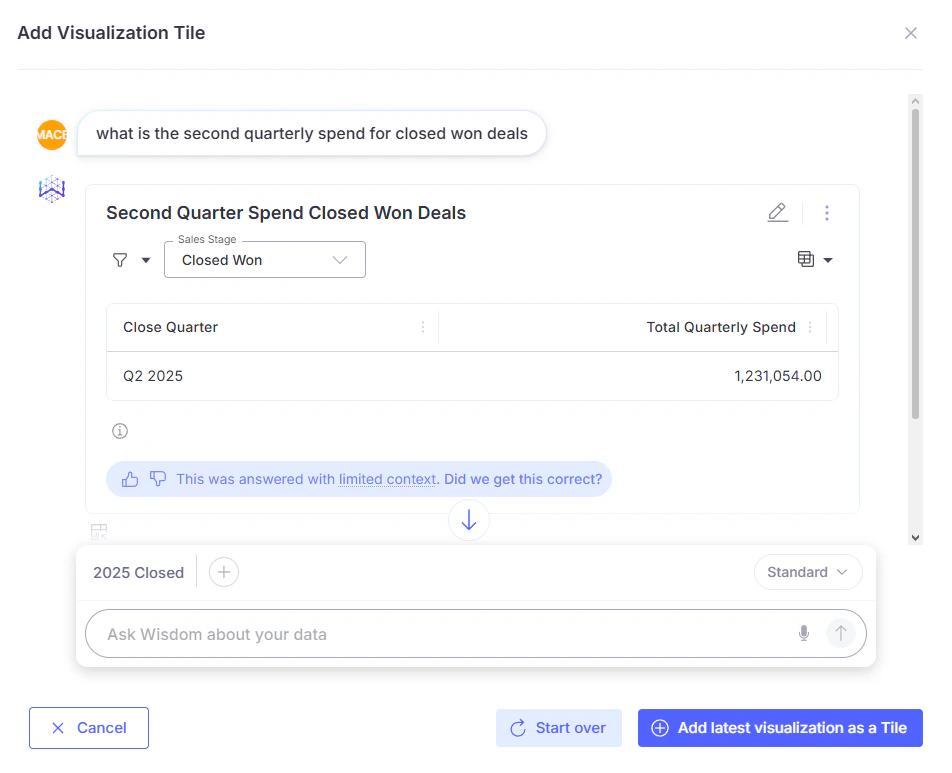
You can add new tiles to the dashboard directly from a chat response. Three tile types are available:- Visualization: Wisdom queries your connected data source and returns an answer to your input. You can review the result, and once you’re happy, click Add latest visualization as a Tile to lock it onto your dashboard. From then on, that metric is always visible without having to ask the question again.
- SQL query: A tile that runs a custom SQL query directly against your data source. When you add a SQL tile, WisdomAI automatically generates the query based on your question. You can review and edit the query in the built-in SQL editor, give the tile a title, then click Execute SQL to preview the result. Once confirmed, click Add as Tile to pin it to your dashboard.
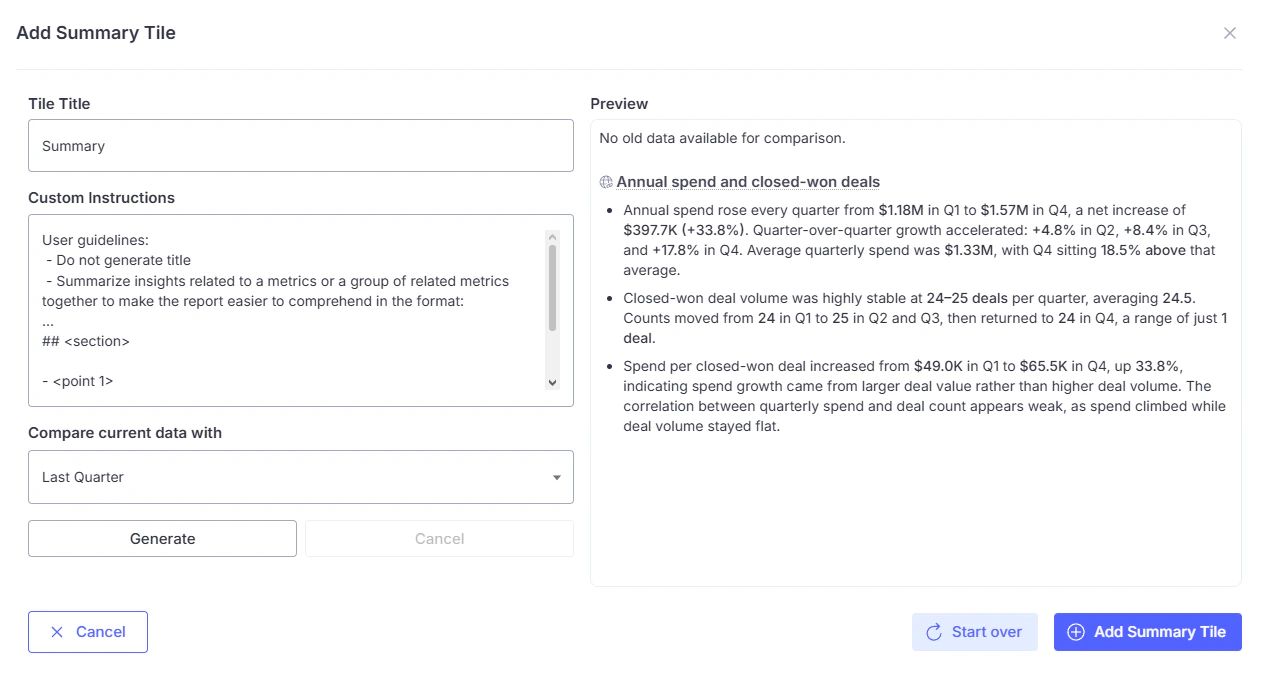
- Summary: A narrative text tile generated by WisdomAI that interprets and explains your dashboard data. When you add a summary tile, you can give it a title, write custom instructions to guide the format and focus of the summary.
Next steps
Schedule Dashboard Notifications
Set up automated notifications to keep stakeholders updated with the latest dashboard insights.
Share Dashboards and Set Access Control
Learn how to share your dashboards with others and manage who can view or edit them.