How it works
When you ask a question that requires advanced computation, WisdomAI follows this process:- Retrieves data: If the analysis needs data from your database, WisdomAI first queries it using SQL.
- Generates Python code: WisdomAI translates your natural-language instruction into Python code.
- Visualizes the result: The result is automatically visualized as a chart or table—you do not need to write any plotting code.
Enable or disable the tool
Before asking a question, make sure the Python Interpreter tool is enabled in the chat interface.- Open a Chat in WisdomAI.
- Locate the experimental tools selector in the chat input area.
- Toggle Python Interpreter on or off.
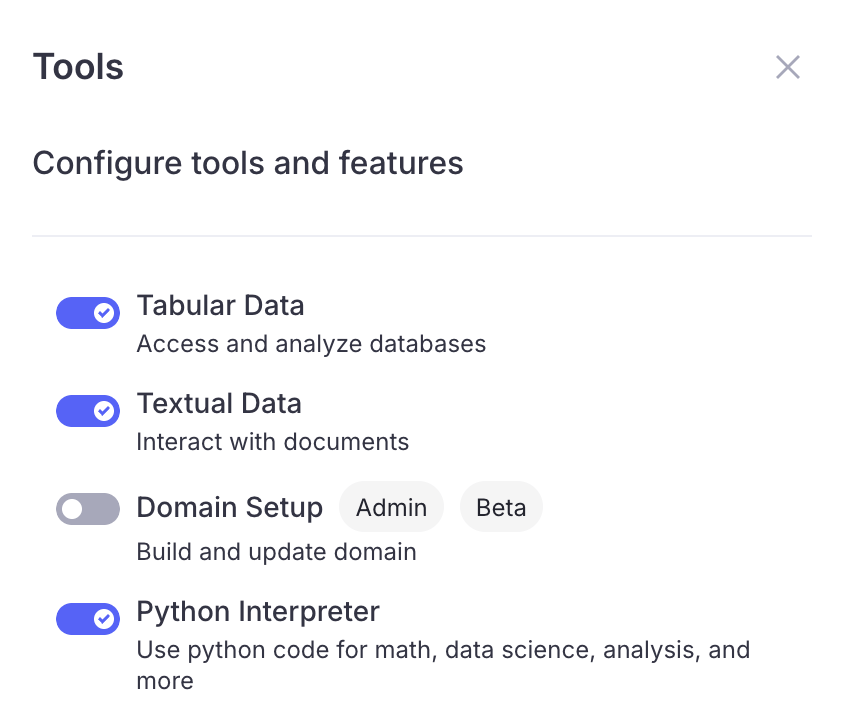
Your preference is saved and persists across sessions. When enabled, WisdomAI will use the tool automatically when your question requires Python-level analysis. When disabled, only SQL-based analysis is available.
What you can do
Perform the following data science tasks and advanced transformations directly within your chat sessions:Mathematical calculations
Ask any arithmetic or mathematical question, and WisdomAI will compute it with Python rather than relying on approximations.What is the compound annual growth rate of revenue from 2020 to 2024?Calculate the standard deviation of deal sizes across all closed-won opportunities.
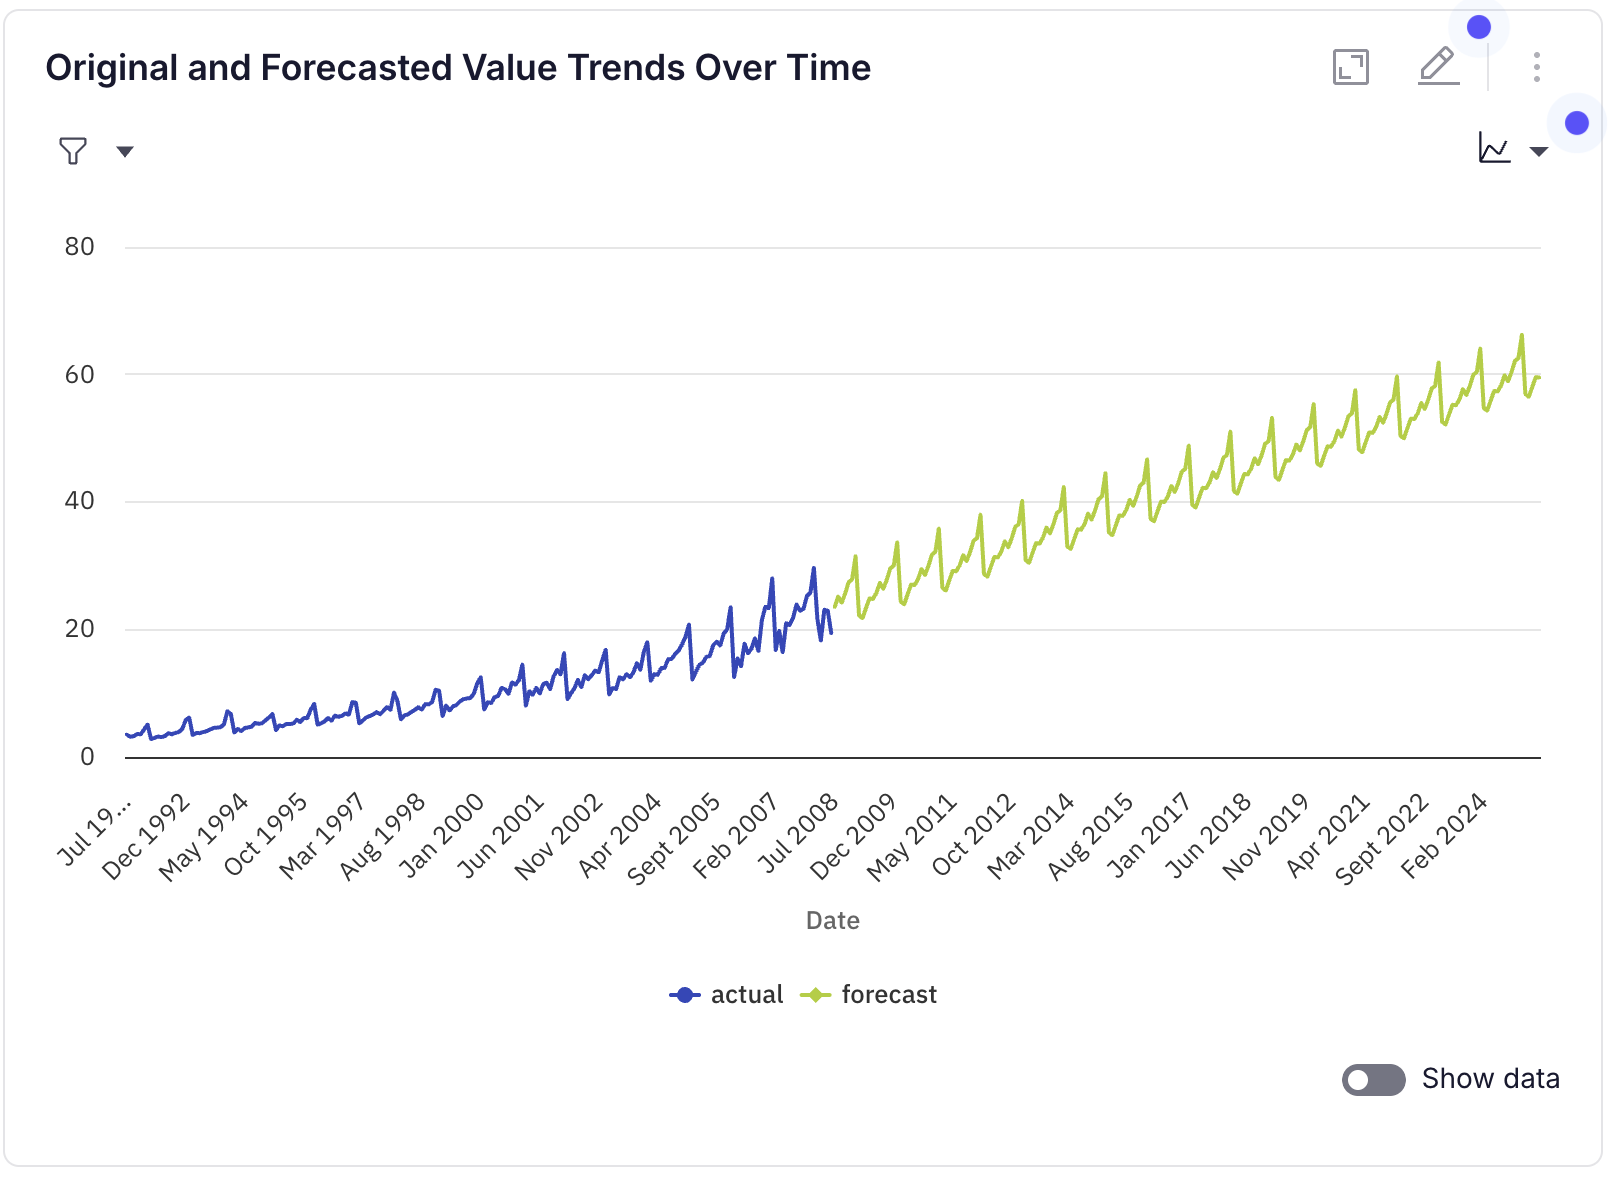
Time-series forecasting
Forecast future values using statistical models. WisdomAI selects the appropriate method based on your data. Example questions:Forecast monthly revenue for the next 12 months.Predict weekly active users for Q3 based on historical trends.
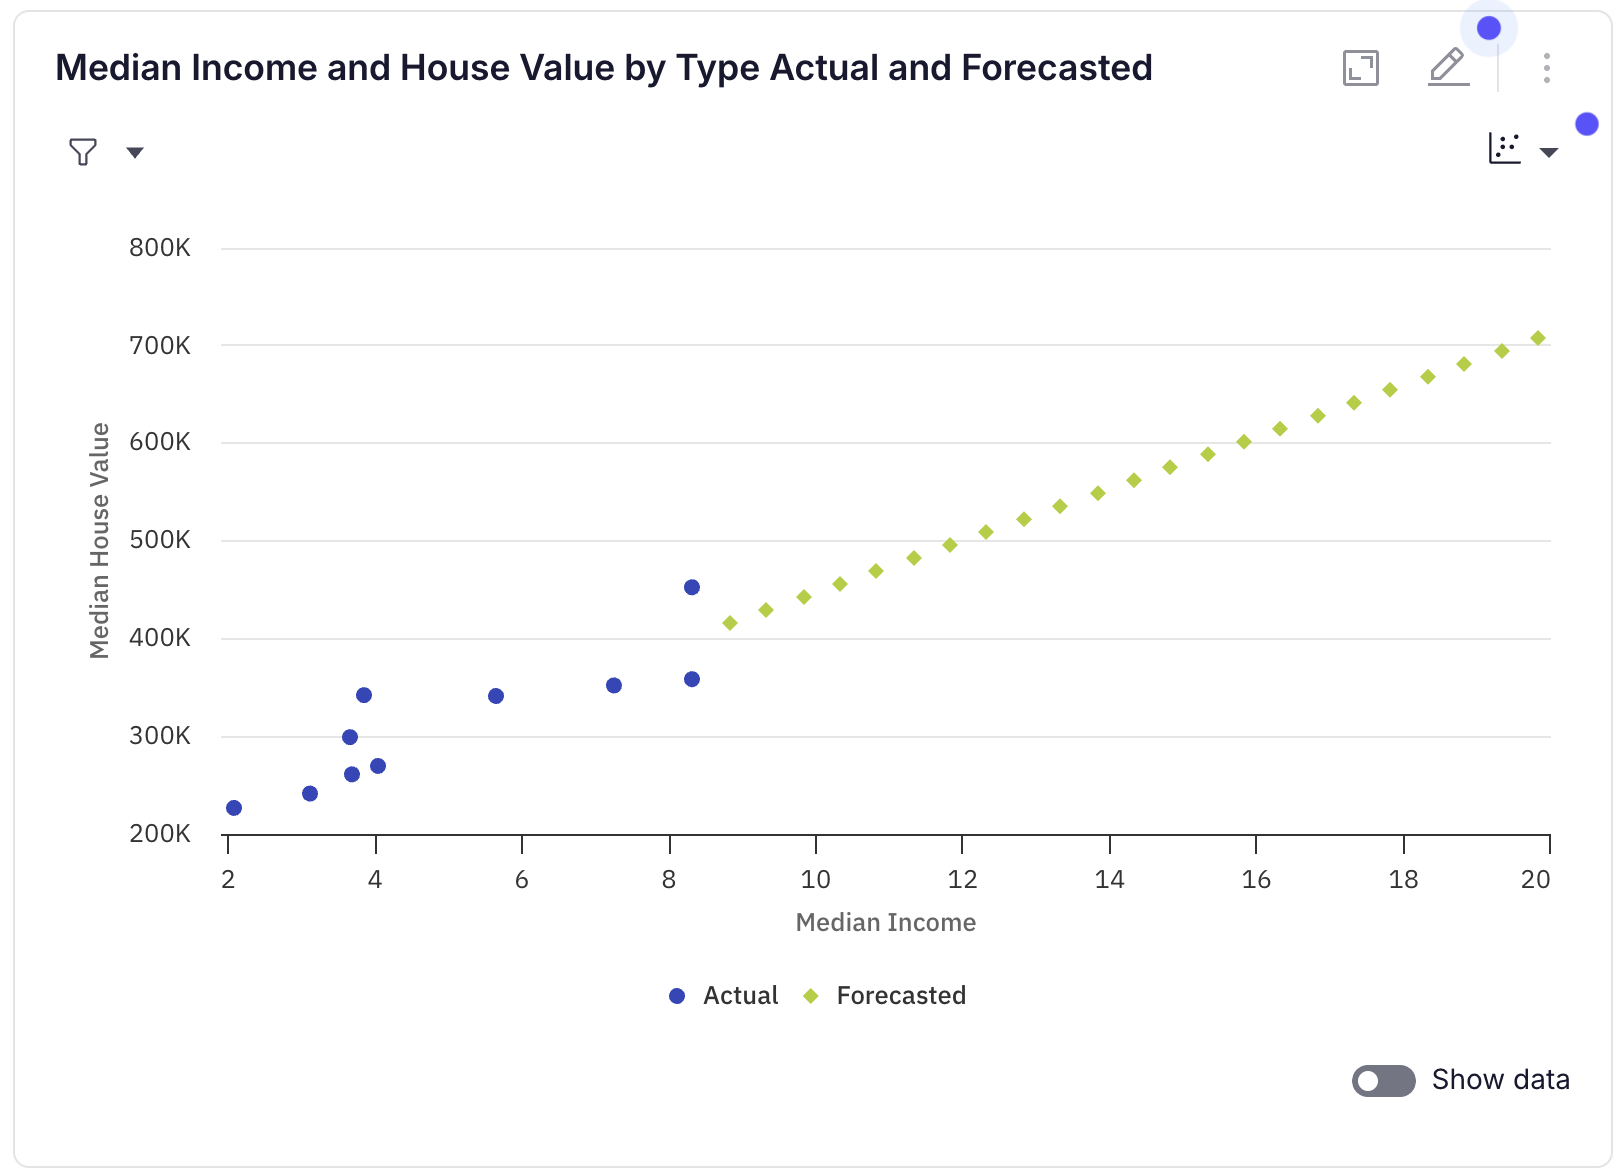
Regression Analysis
Fit regression models to understand relationships between variables or extrapolate trends. Example questions:What is the relationship between marketing spend and revenue?If we increase headcount from 50 to 100 in steps of 5, what is the projected output?
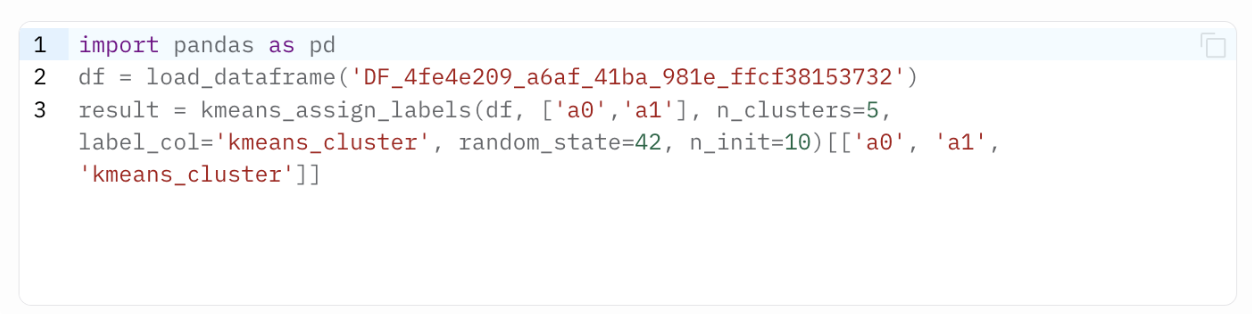
Clustering
Group data points into clusters to discover natural segments in your data.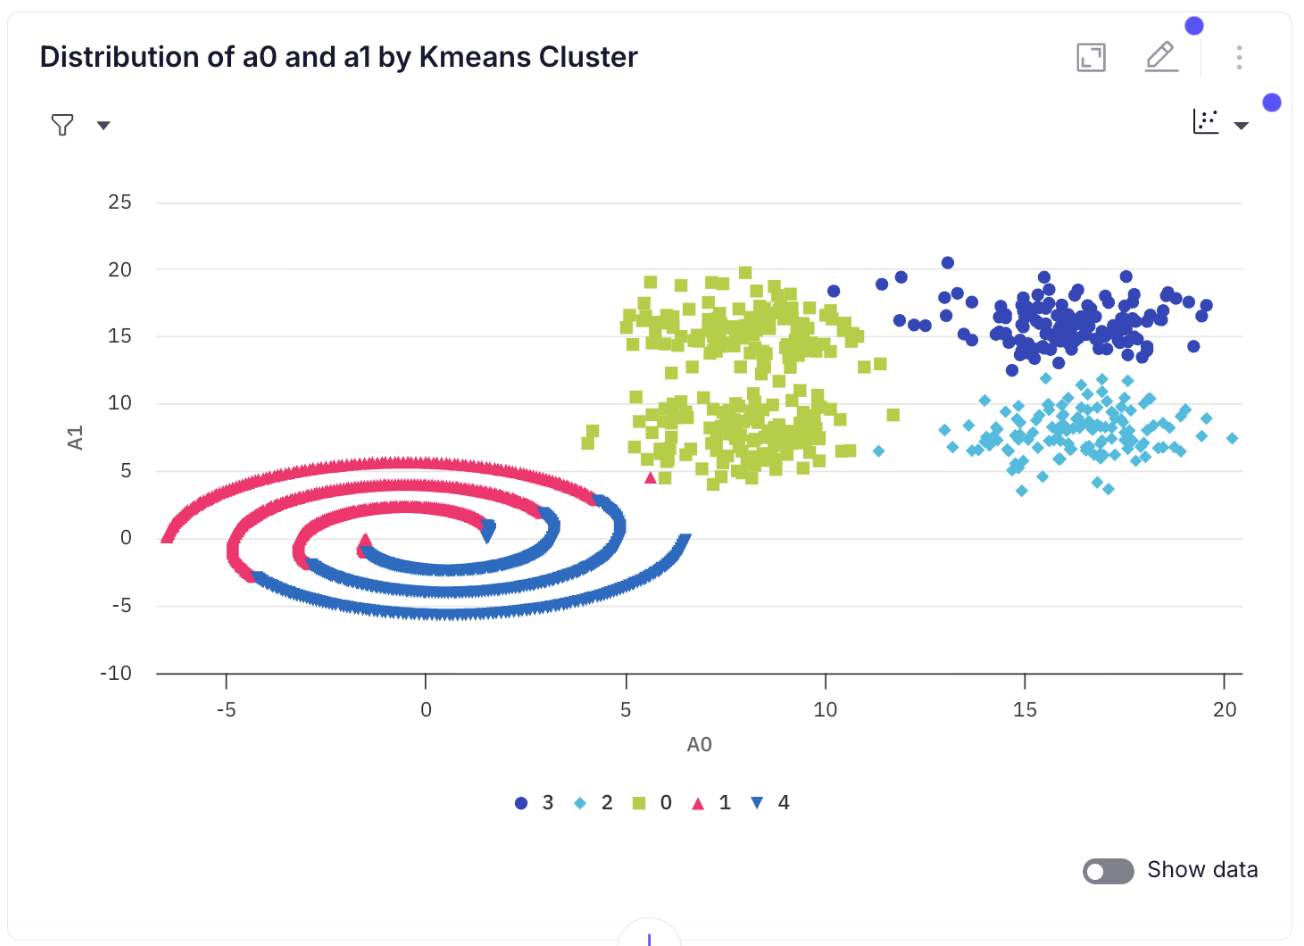
Data manipulation and transformation
Perform pandas-style operations that SQL cannot express, such as pivoting, rolling windows, or custom row-level logic. Example questions:Calculate the 7-day rolling average of daily signups.Merge the sales and returns tables on order_id and compute net revenue per product.Pivot the data so each region becomes a column with total sales as values.
Available Python libraries
Code generated by WisdomAI runs in a secure, sandboxed environment. Only a curated set of Python libraries is available for import. Any attempt to import a module outside of this list will be blocked. The following libraries are allowed:collections csv datetime functools itertools json math numpy pandas prophet random re scipy sklearn statsmodels string
If you need a module that is not listed above, contact the WisdomAI support team for assistance.
Tips for best results
- Be specific about the analysis you want. Instead of “analyze sales,” ask “forecast monthly sales for the next 6 months using the last 2 years of data.” Specificity helps WisdomAI choose the right method and parameters.
- Fetch data first, then analyze. For data science tasks, WisdomAI follows a two-step process: first, query data via SQL, then analyze it with Python. If you notice missing data, ask for a follow-up to retrieve the full dataset before re-running the analysis.
- Ask to adjust parameters. After a forecasting or regression result, you can ask WisdomAI to change the method or tune parameters. For example: “Redo the forecast using ETS with multiplicative seasonality” or “Try Ridge regression with alpha=0.5.”
- Use follow-up questions. The result persists in your conversation. You can ask follow-up questions like “Now filter this to only show Q4” or “Add a trend line to the existing data.”
Use case examples
Forecasting revenue
- Scenario: You need to forecast next quarter’s revenue using historical monthly data.
- Question:
Forecast monthly revenue for the next 3 months based on the last 2 years of data. - Outcome: WisdomAI first queries your revenue data, then runs a SARIMAX or ETS forecast, and presents both the historical and forecasted values in a single line chart.
Segmenting customers
- Scenario: You want to identify natural customer segments for a marketing campaign.
- Question:
Cluster our customers into groups based on total spend and order frequency. Suggest the best number of clusters. - Outcome: WisdomAI queries customer metrics, runs K-Means with silhouette scoring to determine the optimal number of groups, and presents a scatter plot with color-coded clusters.
What-if analysis
- Scenario: You want to understand how increasing ad spend might affect conversions.
- Question:
Based on historical data, if we increase ad spend from $10K to $50K in $5K steps, what are the projected conversions? - Outcome: WisdomAI fits a linear regression on historical ad spend vs. conversions, extrapolates over the specified range, and shows both the original data and projected values.
Next steps
Deep Analysis
Investigate complex, multi-step questions with automated research plans and detailed reports.
Visualization Types
Explore all available chart types and how to customize your data presentation.
Ask Better Questions
Learn how to phrase questions for the best and most accurate results.
Build Dashboards
Pin analysis results to dashboards for ongoing monitoring and sharing.