> ## Documentation Index
> Fetch the complete documentation index at: https://docs.wisdom.ai/llms.txt
> Use this file to discover all available pages before exploring further.
# Overview Tab
The Overview tab serves as a central dashboard, providing a high-level summary of your domain's health, content, and activity. You can quickly grasp key metrics and statuses at a glance.
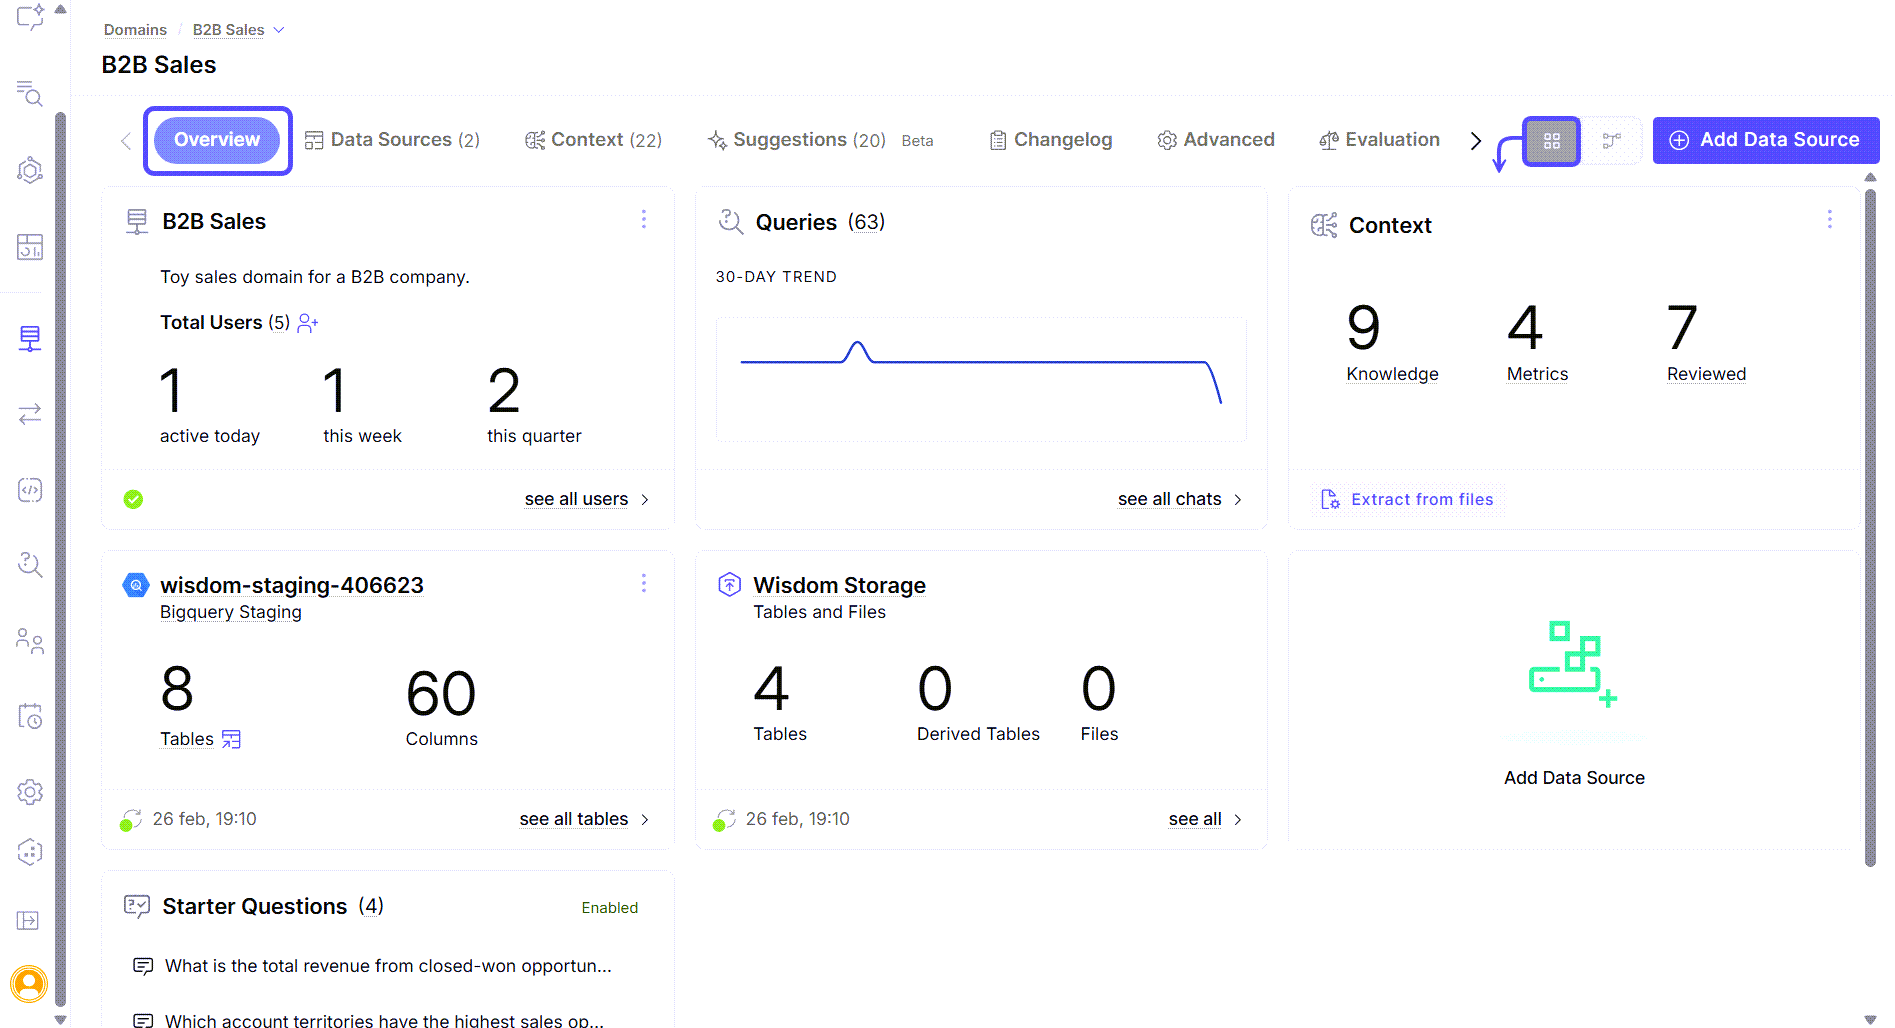
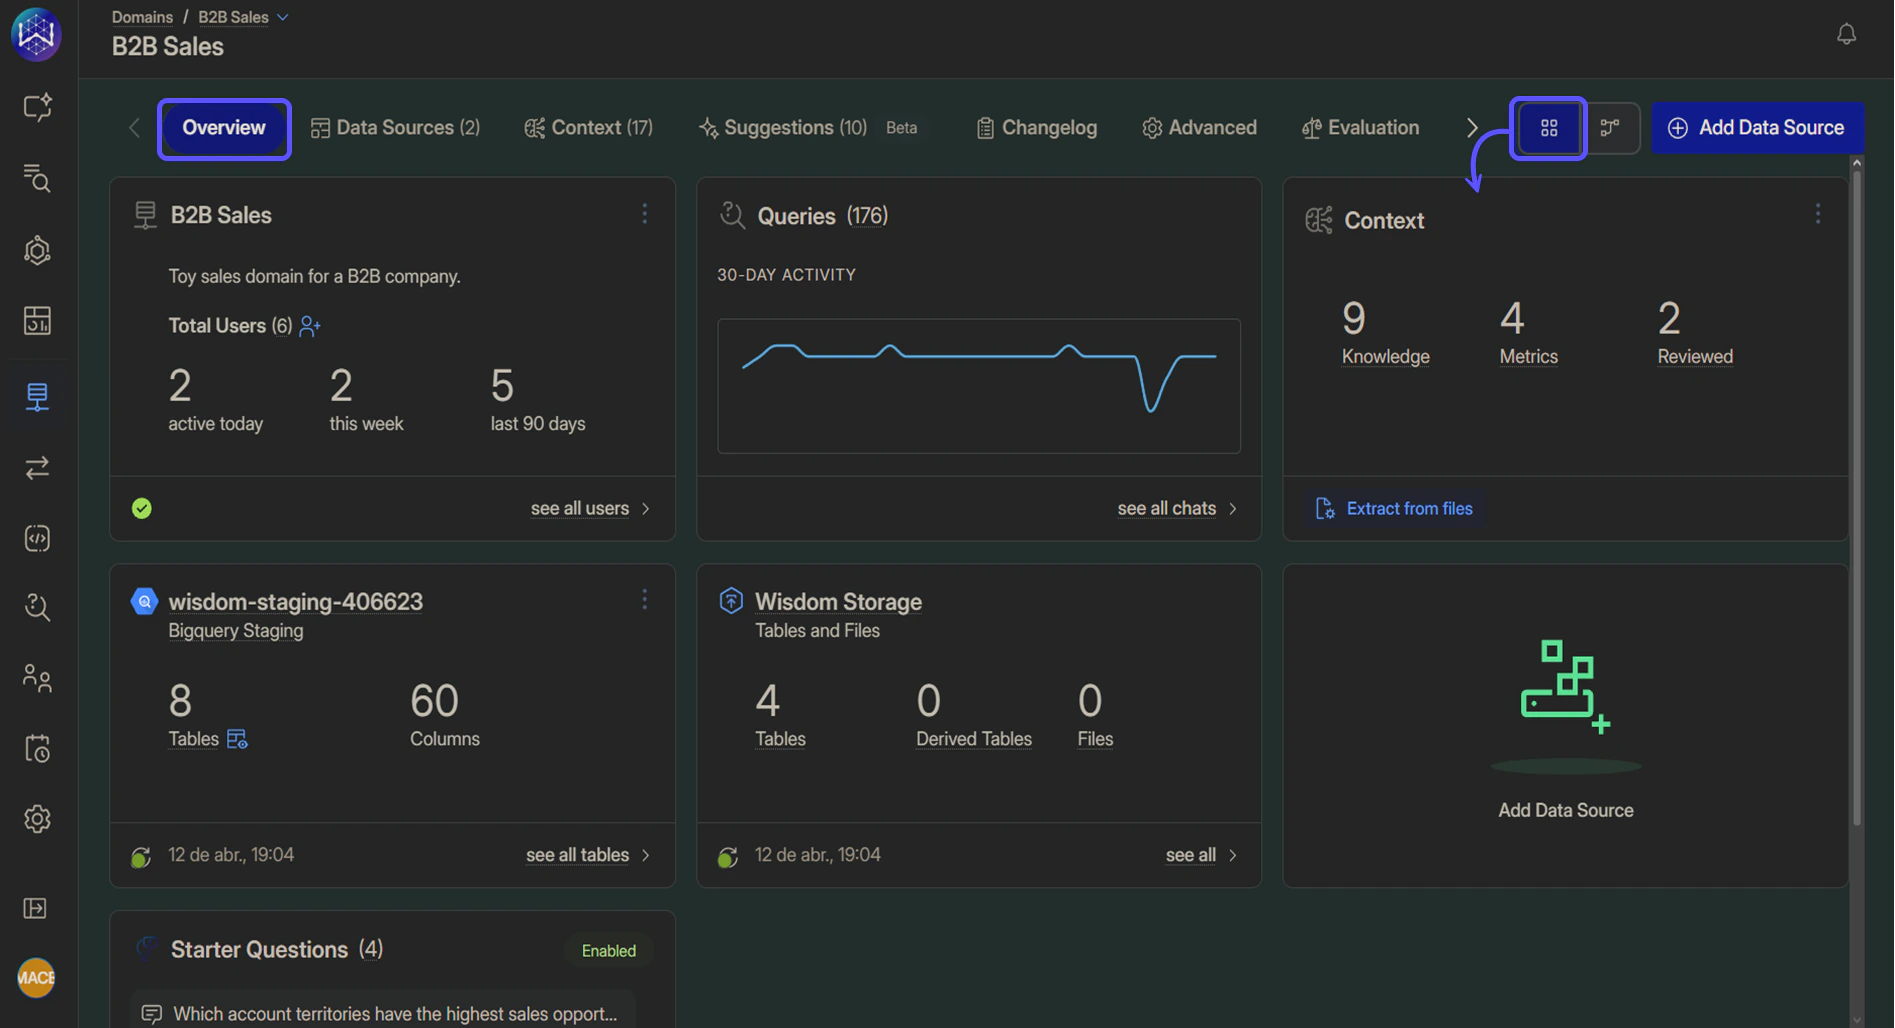 The Overview tab displays the following options:
* **Domain name and description:** Displays the domain title and a short description.
* **Queries:** Shows the total number of queries and a 30-day usage trend.
* **Context:** Provides a count of configured Knowledge entries, Metrics, and Reviewed Queries.
* **Connected data sources:** Displays one card per connected data source (for example, database connections or file uploads), including:
* Number of tables
* Number of columns
* Last synchronization status
* **MCP Servers:** If connected, displays one card per MCP server showing the server name, total number of tools, and how many tools are enabled.
* **Web Search:** If enabled, displays a card showing the current source policy (Allowlist, Blocklist, or All domains) and the number of configured domains.
* **Files:** Indicates the number of datasets and uploaded files associated with the domain.
* **Starter Questions:** Lists example questions configured to guide new users.
The Overview tab displays the following options:
* **Domain name and description:** Displays the domain title and a short description.
* **Queries:** Shows the total number of queries and a 30-day usage trend.
* **Context:** Provides a count of configured Knowledge entries, Metrics, and Reviewed Queries.
* **Connected data sources:** Displays one card per connected data source (for example, database connections or file uploads), including:
* Number of tables
* Number of columns
* Last synchronization status
* **MCP Servers:** If connected, displays one card per MCP server showing the server name, total number of tools, and how many tools are enabled.
* **Web Search:** If enabled, displays a card showing the current source policy (Allowlist, Blocklist, or All domains) and the number of configured domains.
* **Files:** Indicates the number of datasets and uploaded files associated with the domain.
* **Starter Questions:** Lists example questions configured to guide new users.
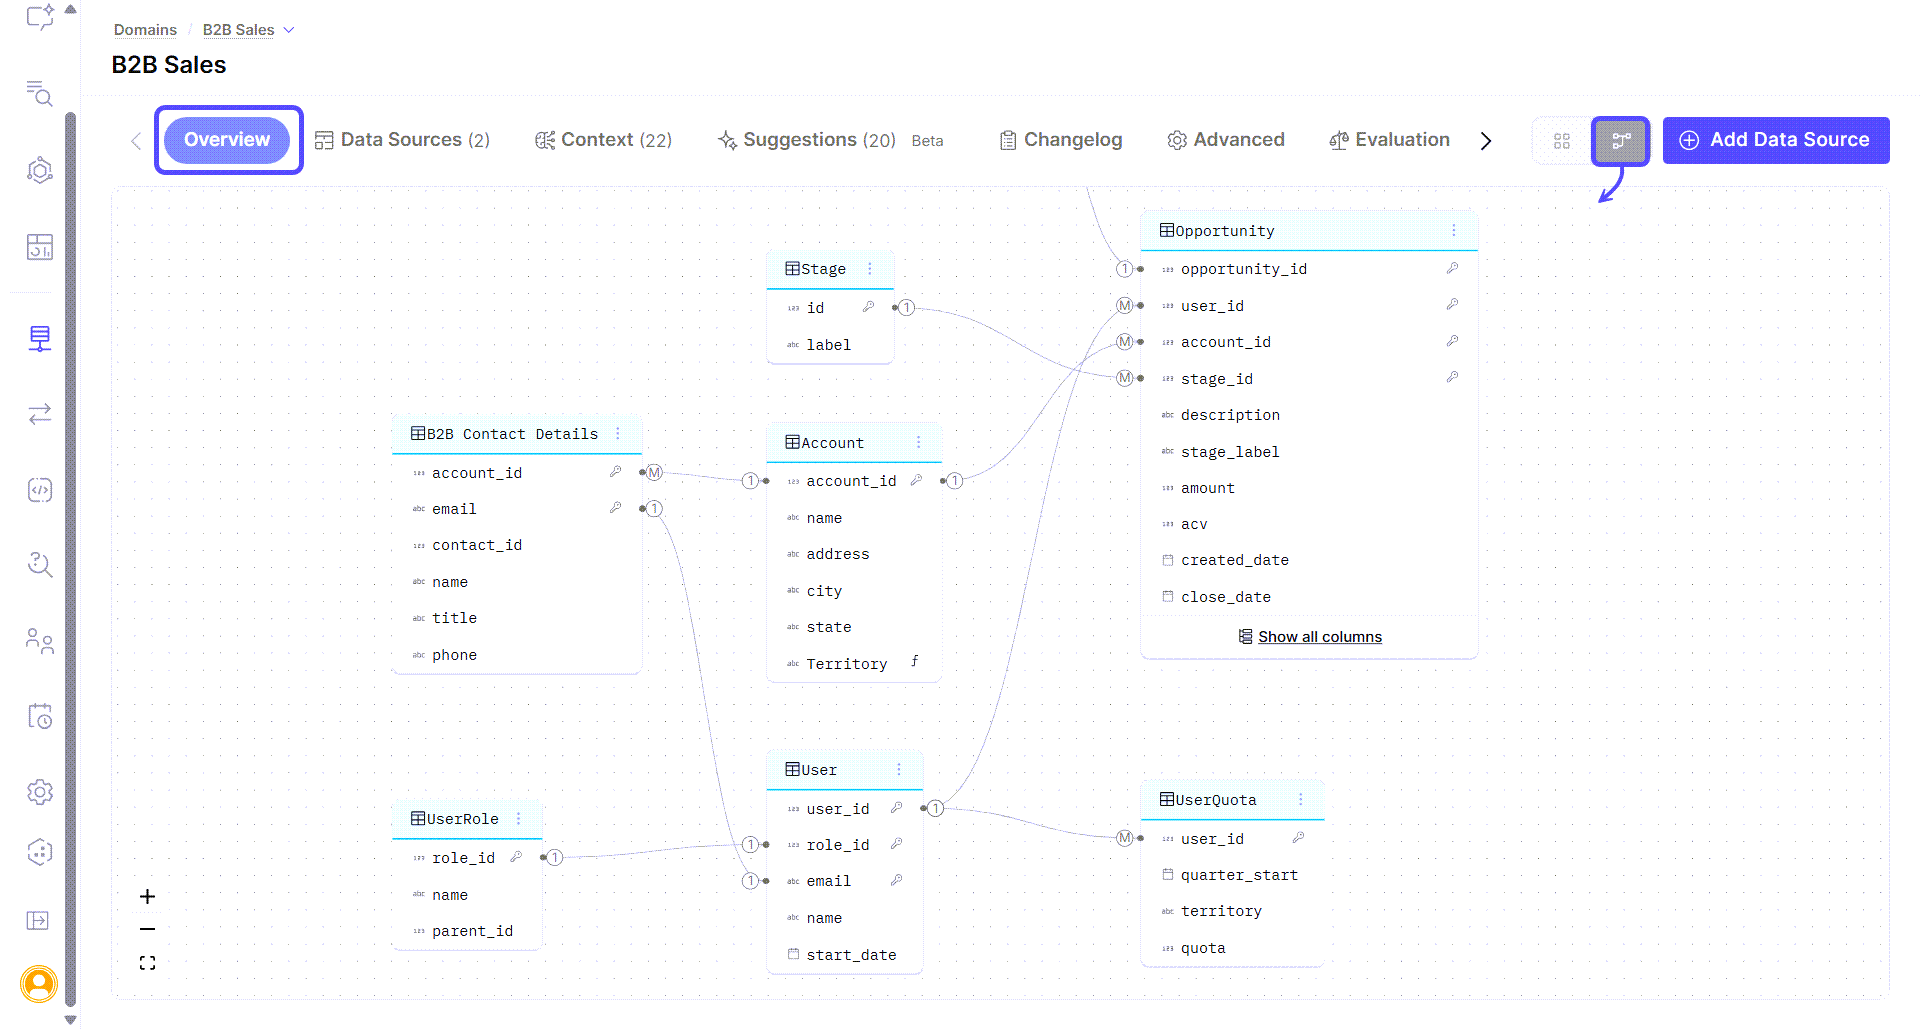
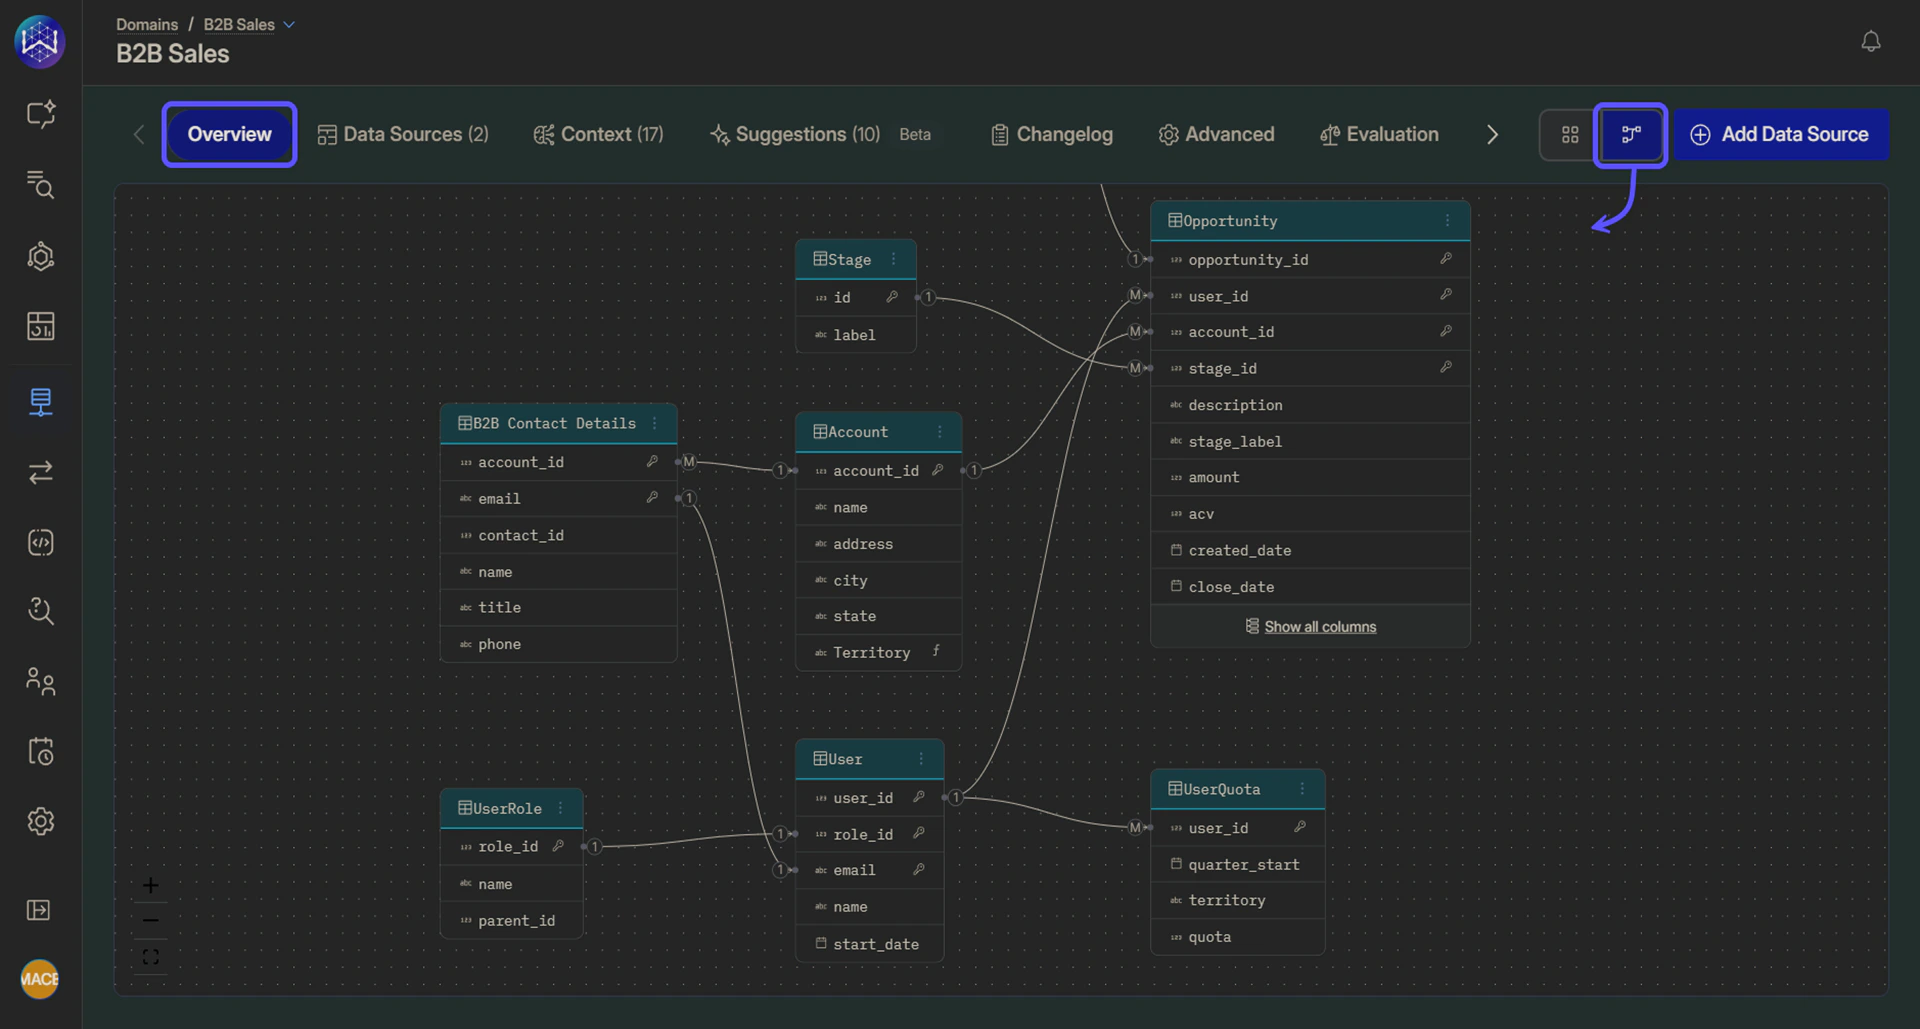 From the Overview tab, you can also switch to a diagram view that visualizes the domain’s data model. This view displays:
* Tables as nodes
* Relationships between tables
* Key columns used to join data
Use the diagram view to quickly understand how entities relate to one another and to validate the domain's overall structure at a glance.
The diagram view is read-only and is intended for exploration and orientation. To manage tables or relationships, use the [Data Sources](/setting-up-wisdom-ai/manage-domains/data-sources-tab) tab.
From the Overview tab, you can also switch to a diagram view that visualizes the domain’s data model. This view displays:
* Tables as nodes
* Relationships between tables
* Key columns used to join data
Use the diagram view to quickly understand how entities relate to one another and to validate the domain's overall structure at a glance.
The diagram view is read-only and is intended for exploration and orientation. To manage tables or relationships, use the [Data Sources](/setting-up-wisdom-ai/manage-domains/data-sources-tab) tab.