> ## Documentation Index
> Fetch the complete documentation index at: https://docs.wisdom.ai/llms.txt
> Use this file to discover all available pages before exploring further.
# Basic Tutorial: Connect and Test
This tutorial is intended for Admin users who are responsible for configuring data sources and setting up WisdomAI.
## Learning objectives
By the end of this tutorial, you will be able to:
* Connect to your Database.
* Start querying your data to test WisdomAI.
* Provide feedback so the system can refine its context based on your input.
Once you have completed this tutorial, you will have WisdomAI connected to your data and ready to improve through real-time interaction and feedback.
## Before you begin
To follow this tutorial, you should:
* Have Admin access to your WisdomAI account.
* Know the credentials to access your data source.
## 1. Connect to data sources
To get started, you first need to connect your existing data source to WisdomAI so the system can access and prepare your data for use and create reports:
1. Go to the left sidebar and select **Connections**.
2. Click on the **Add Connection** button to start.
This action lets you link your existing data sources to WisdomAI. Doing so enables the system to scan metadata. For data warehouse connections, it also enables WisdomAI to fetch data when users ask natural-language questions.
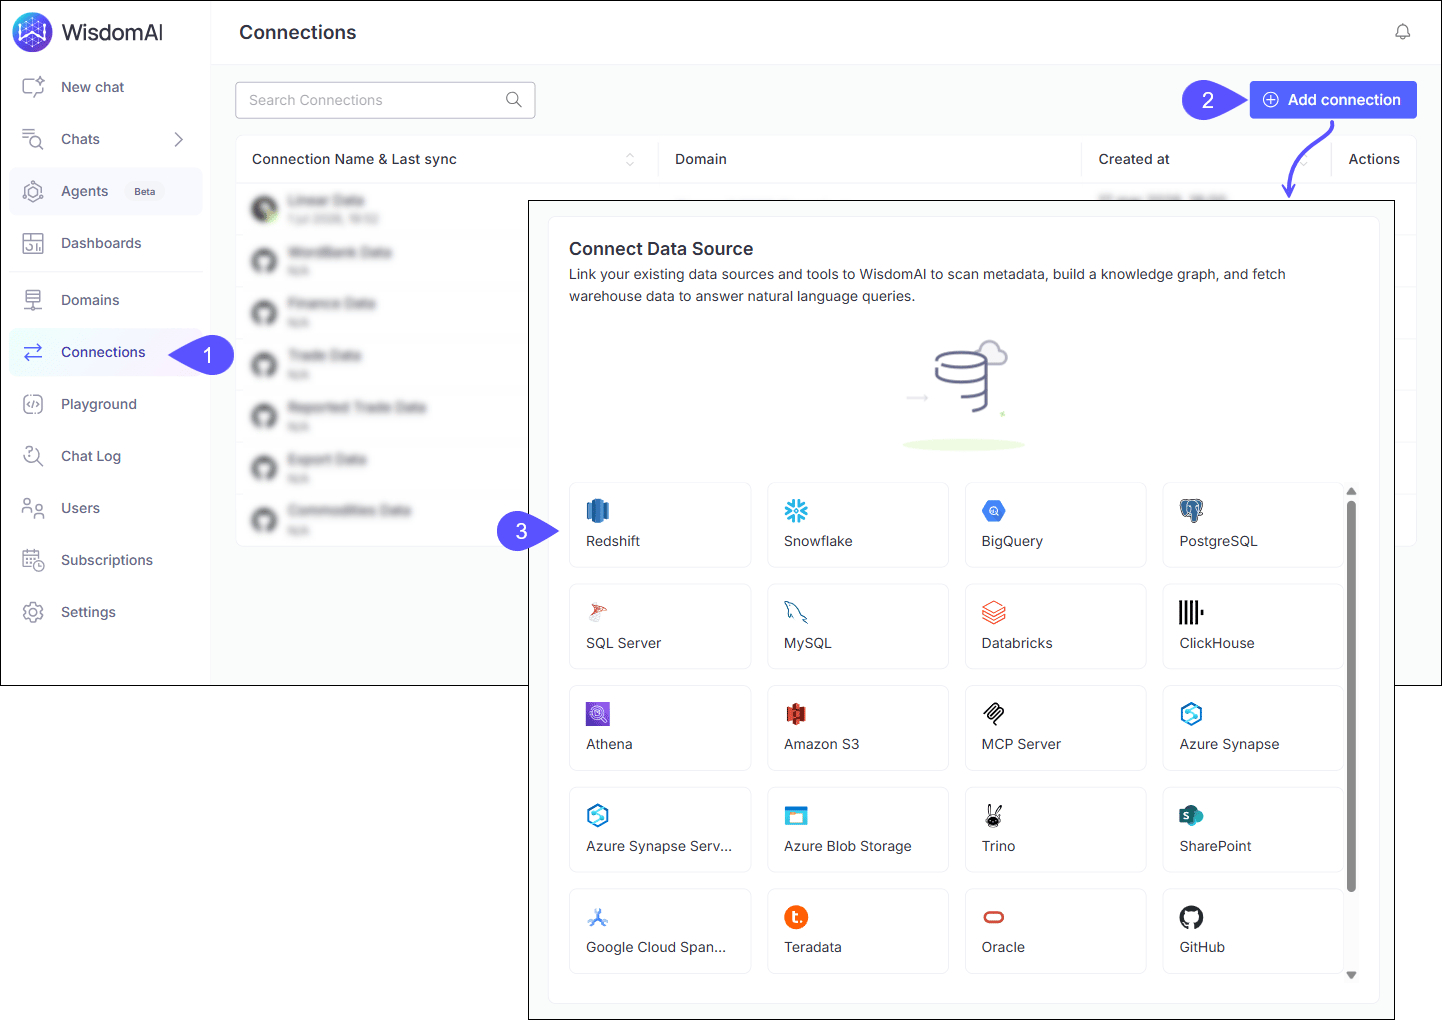
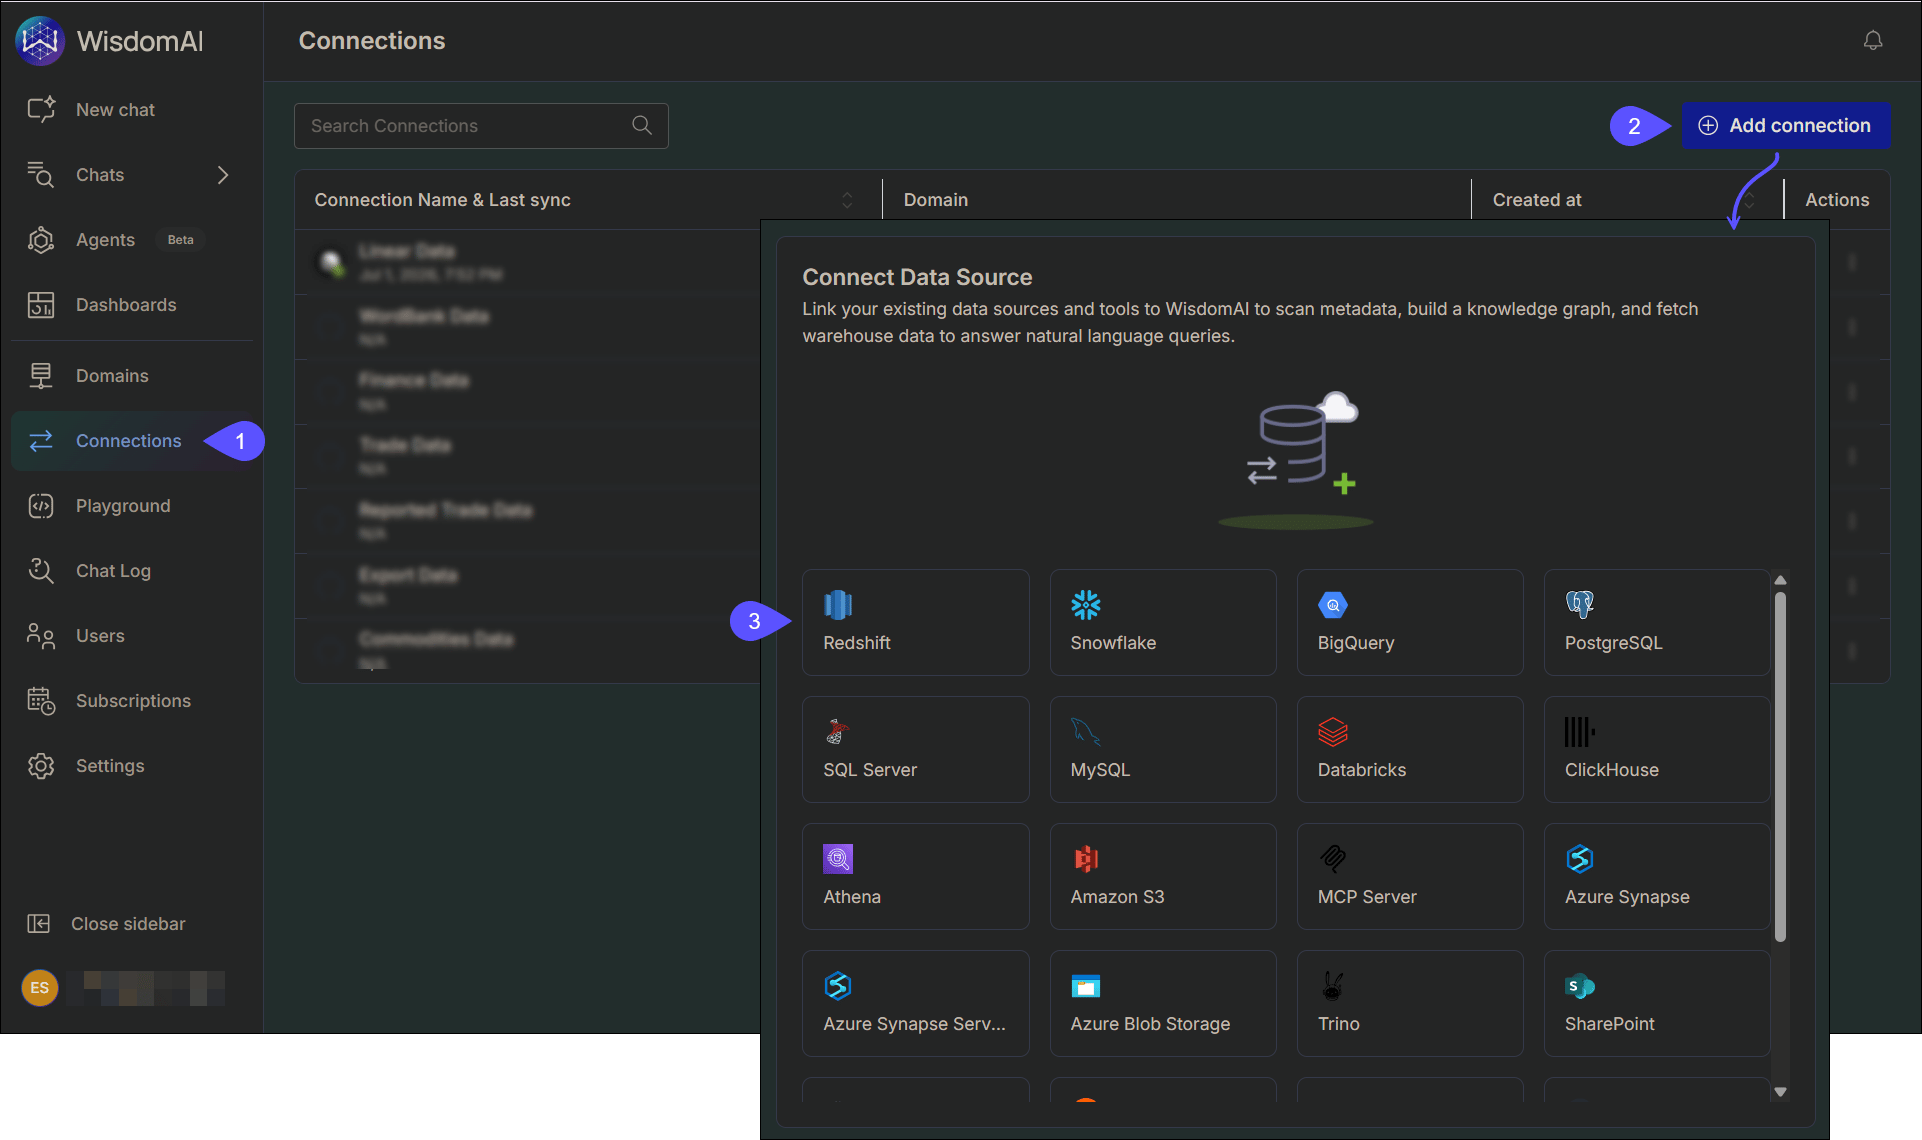 3. Select your data source type from the list (for example, Snowflake, BigQuery, PostgreSQL, or MCP Server).
Access [Supported Data Sources](/getting-started/connect-data-sources/supported-data-sources) to see the complete list of supported data sources by WisdomAI.
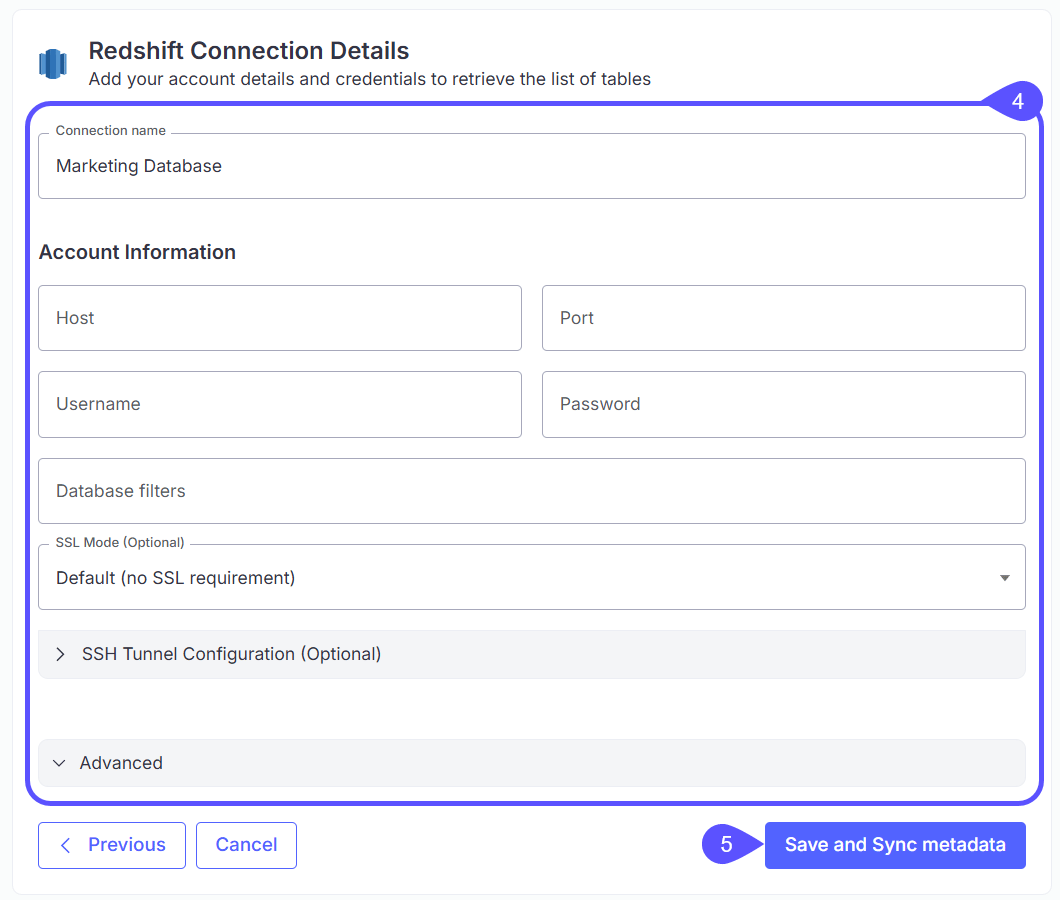
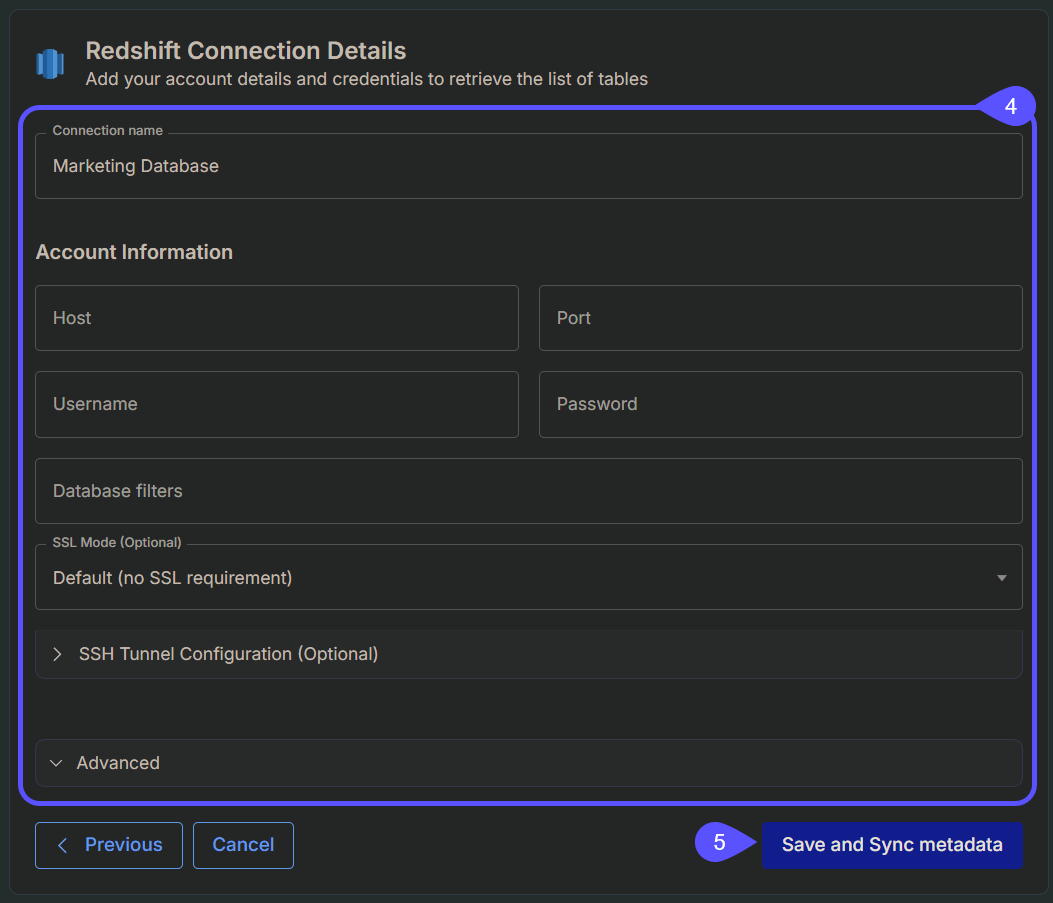
4. Add a **Connection name** and fill in the connection details for your selected data source, such as account information, authentication method, and any relevant filters.
The fields and authentication options shown depend on the data source you selected in step 3. See [Supported Data Sources](/getting-started/connect-data-sources/supported-data-sources) for source-specific setup guides.
5. Click on the **Save and Sync metadata** button.
3. Select your data source type from the list (for example, Snowflake, BigQuery, PostgreSQL, or MCP Server).
Access [Supported Data Sources](/getting-started/connect-data-sources/supported-data-sources) to see the complete list of supported data sources by WisdomAI.
4. Add a **Connection name** and fill in the connection details for your selected data source, such as account information, authentication method, and any relevant filters.
The fields and authentication options shown depend on the data source you selected in step 3. See [Supported Data Sources](/getting-started/connect-data-sources/supported-data-sources) for source-specific setup guides.
5. Click on the **Save and Sync metadata** button.
 **Note on Syncing**: After successfully adding a connection, the initial sync may take a few minutes to complete. Then, data will be available for analysis.
## 2. Select the data
After you add your data source, select the data you want to use in your project. For this, you will need to create a Domain.
1. Go to **Domains** in the left sidebar.
A Domain represents a logical business area or function, such as Sales, Marketing, or Finance. Creating well-defined domains makes data more accessible and relevant to business users.
2. Click on the **Add Domain** button. A new window will open.
3. Enter the **Domain name** and **select the data source** from the dropdown menu.
4. Click **Create Domain** to continue.
**Note on Syncing**: After successfully adding a connection, the initial sync may take a few minutes to complete. Then, data will be available for analysis.
## 2. Select the data
After you add your data source, select the data you want to use in your project. For this, you will need to create a Domain.
1. Go to **Domains** in the left sidebar.
A Domain represents a logical business area or function, such as Sales, Marketing, or Finance. Creating well-defined domains makes data more accessible and relevant to business users.
2. Click on the **Add Domain** button. A new window will open.
3. Enter the **Domain name** and **select the data source** from the dropdown menu.
4. Click **Create Domain** to continue.
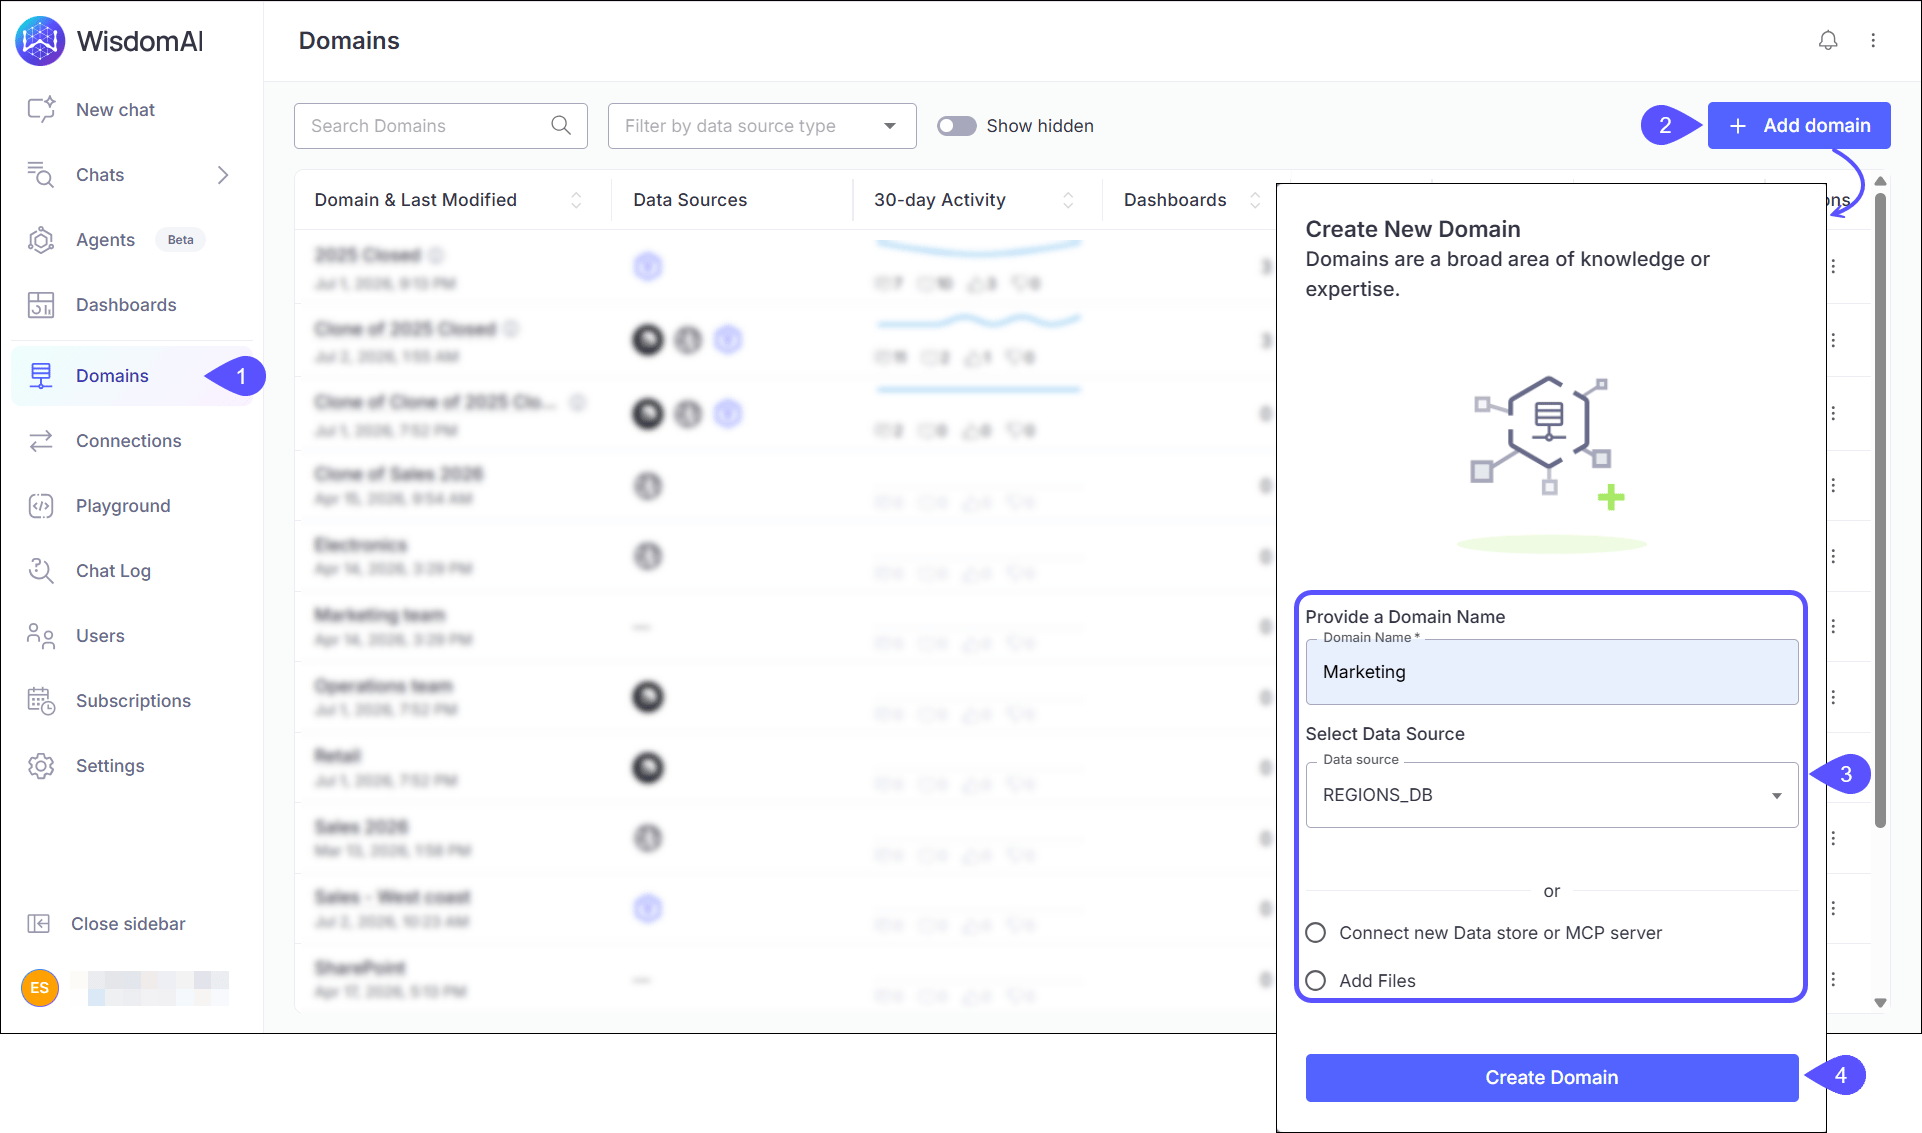
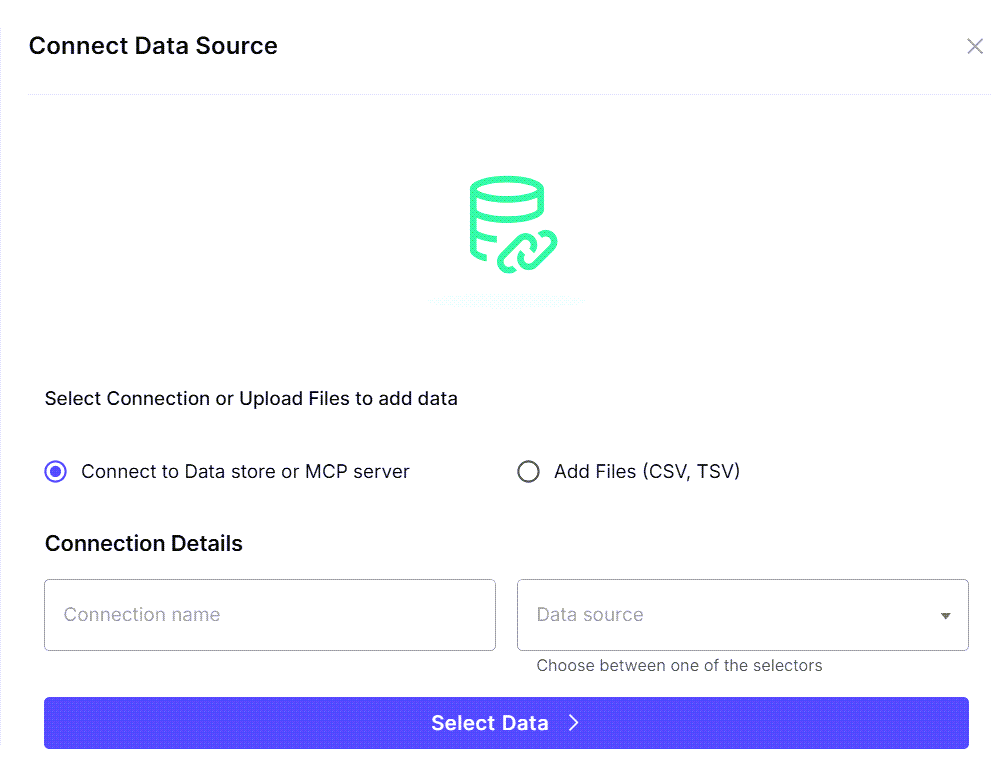
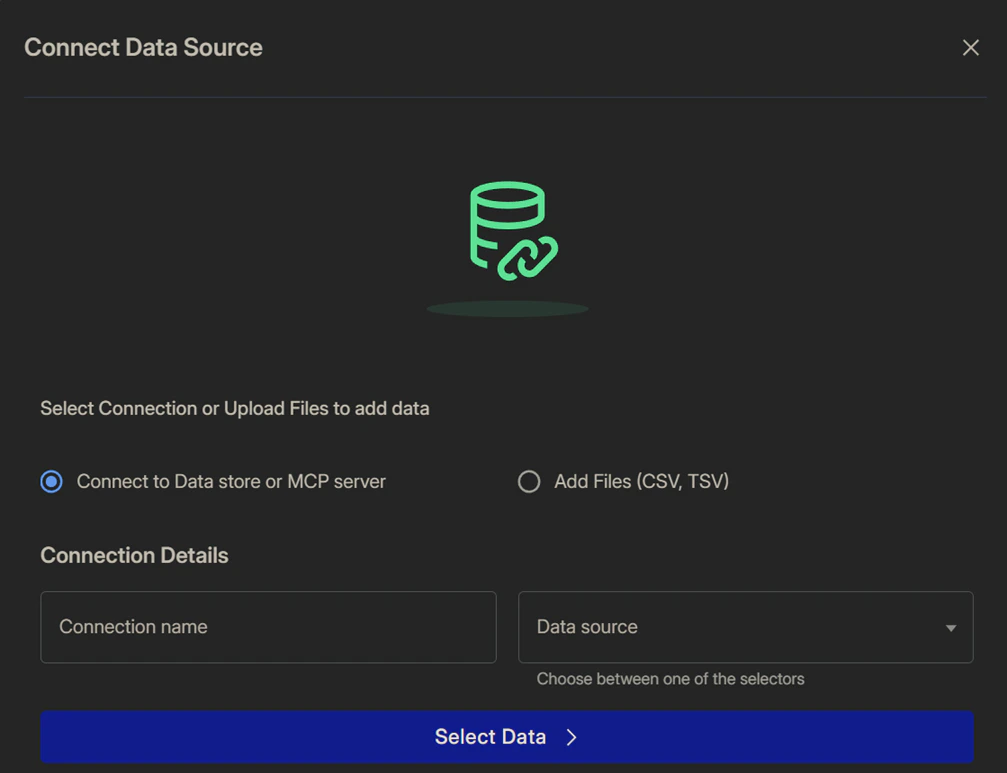
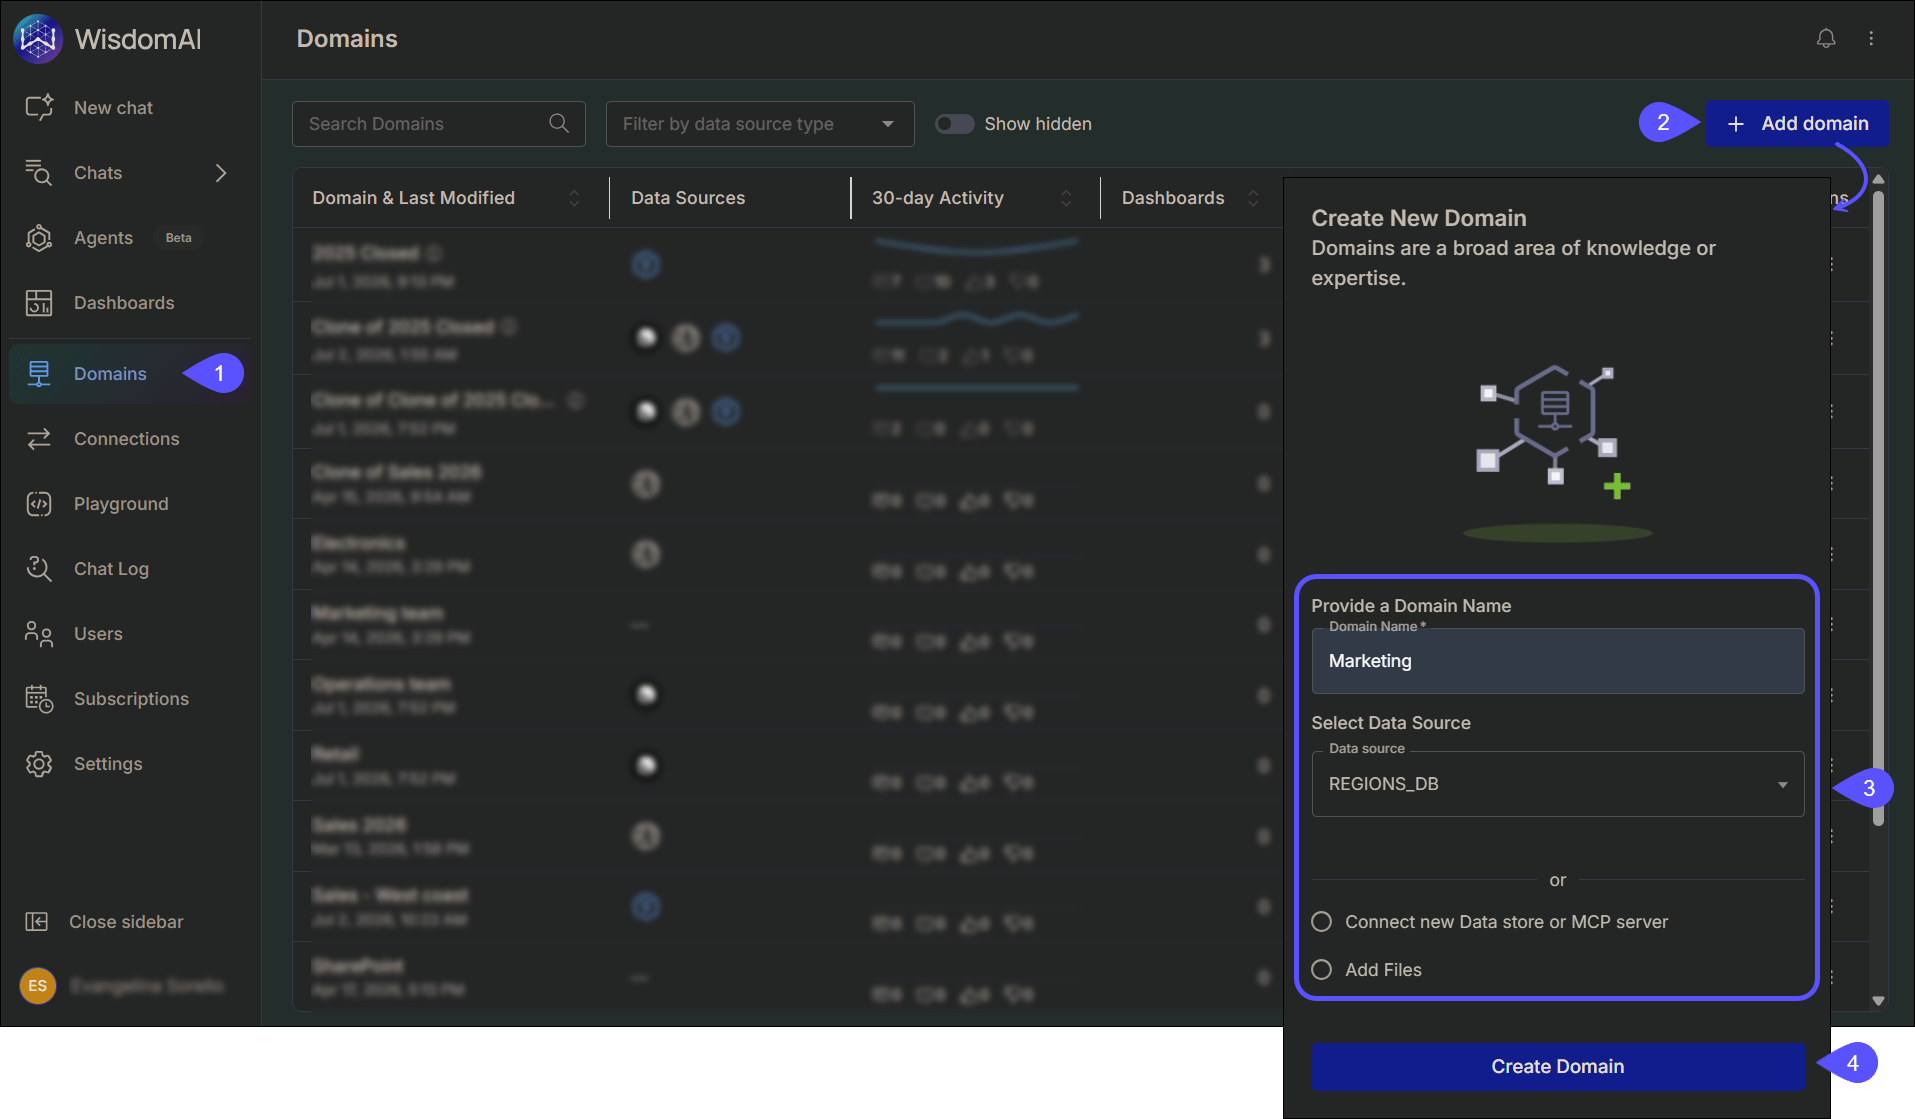 5. The next window will vary depending on what you selected in step 3:
* If you selected an existing **Data source**, choose the **tables** you would like to use, then click **Add Table**.
* If you selected **Add Files**, upload your CSV, TSV, PDF, Word, PowerPoint, or other files, then click **Upload**.
* If you selected **Connect new Data store or MCP server**, configure the connection as prompted, then follow the applicable step to finish adding it (this varies by source type).
6. Click **Add Table** or the corresponding option (e.g., **Upload**), depending on your selection.
Once your data is added, you are ready to start querying it to retrieve information and generate reports about your business.
5. The next window will vary depending on what you selected in step 3:
* If you selected an existing **Data source**, choose the **tables** you would like to use, then click **Add Table**.
* If you selected **Add Files**, upload your CSV, TSV, PDF, Word, PowerPoint, or other files, then click **Upload**.
* If you selected **Connect new Data store or MCP server**, configure the connection as prompted, then follow the applicable step to finish adding it (this varies by source type).
6. Click **Add Table** or the corresponding option (e.g., **Upload**), depending on your selection.
Once your data is added, you are ready to start querying it to retrieve information and generate reports about your business.
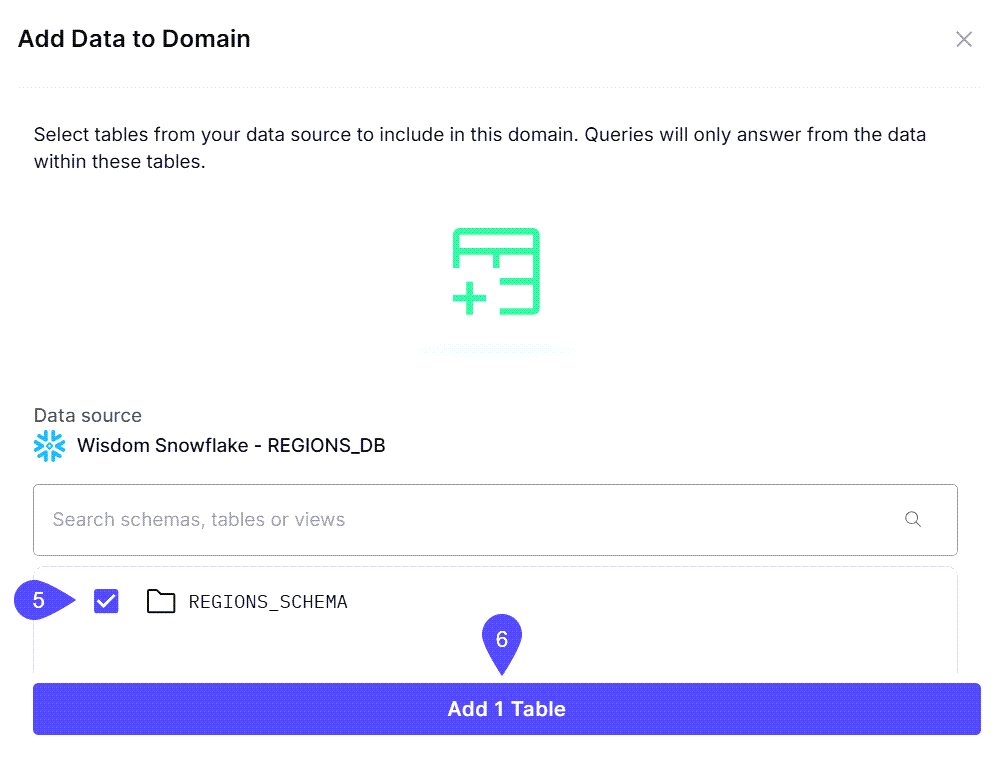
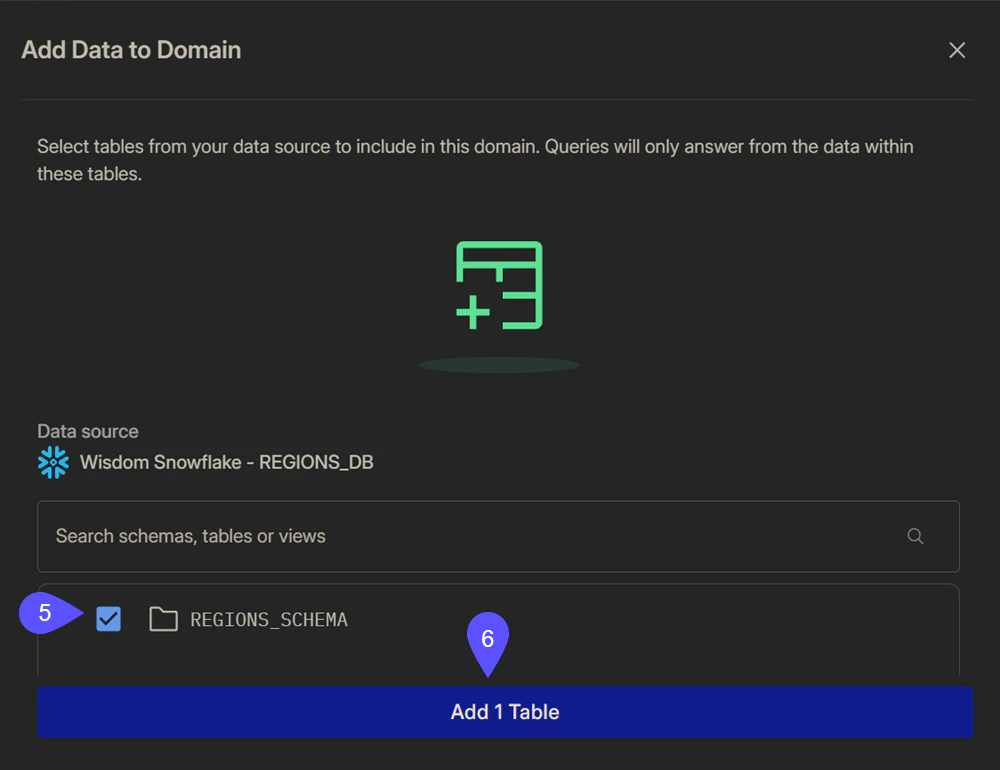 If you want to connect a new source, select this option in step 3. In the same window, you can choose to connect a new Data store or MCP server, or add files (CSV, TSV, or Excel).
 ## 3. Upload CSV files (Optional)
In addition to database connections, Admins can add data directly to a Domain using CSV, TSV, or Excel files. When an Admin adds a file this way, the data becomes a permanent part of the Domain and is available to all users with access to that Domain.
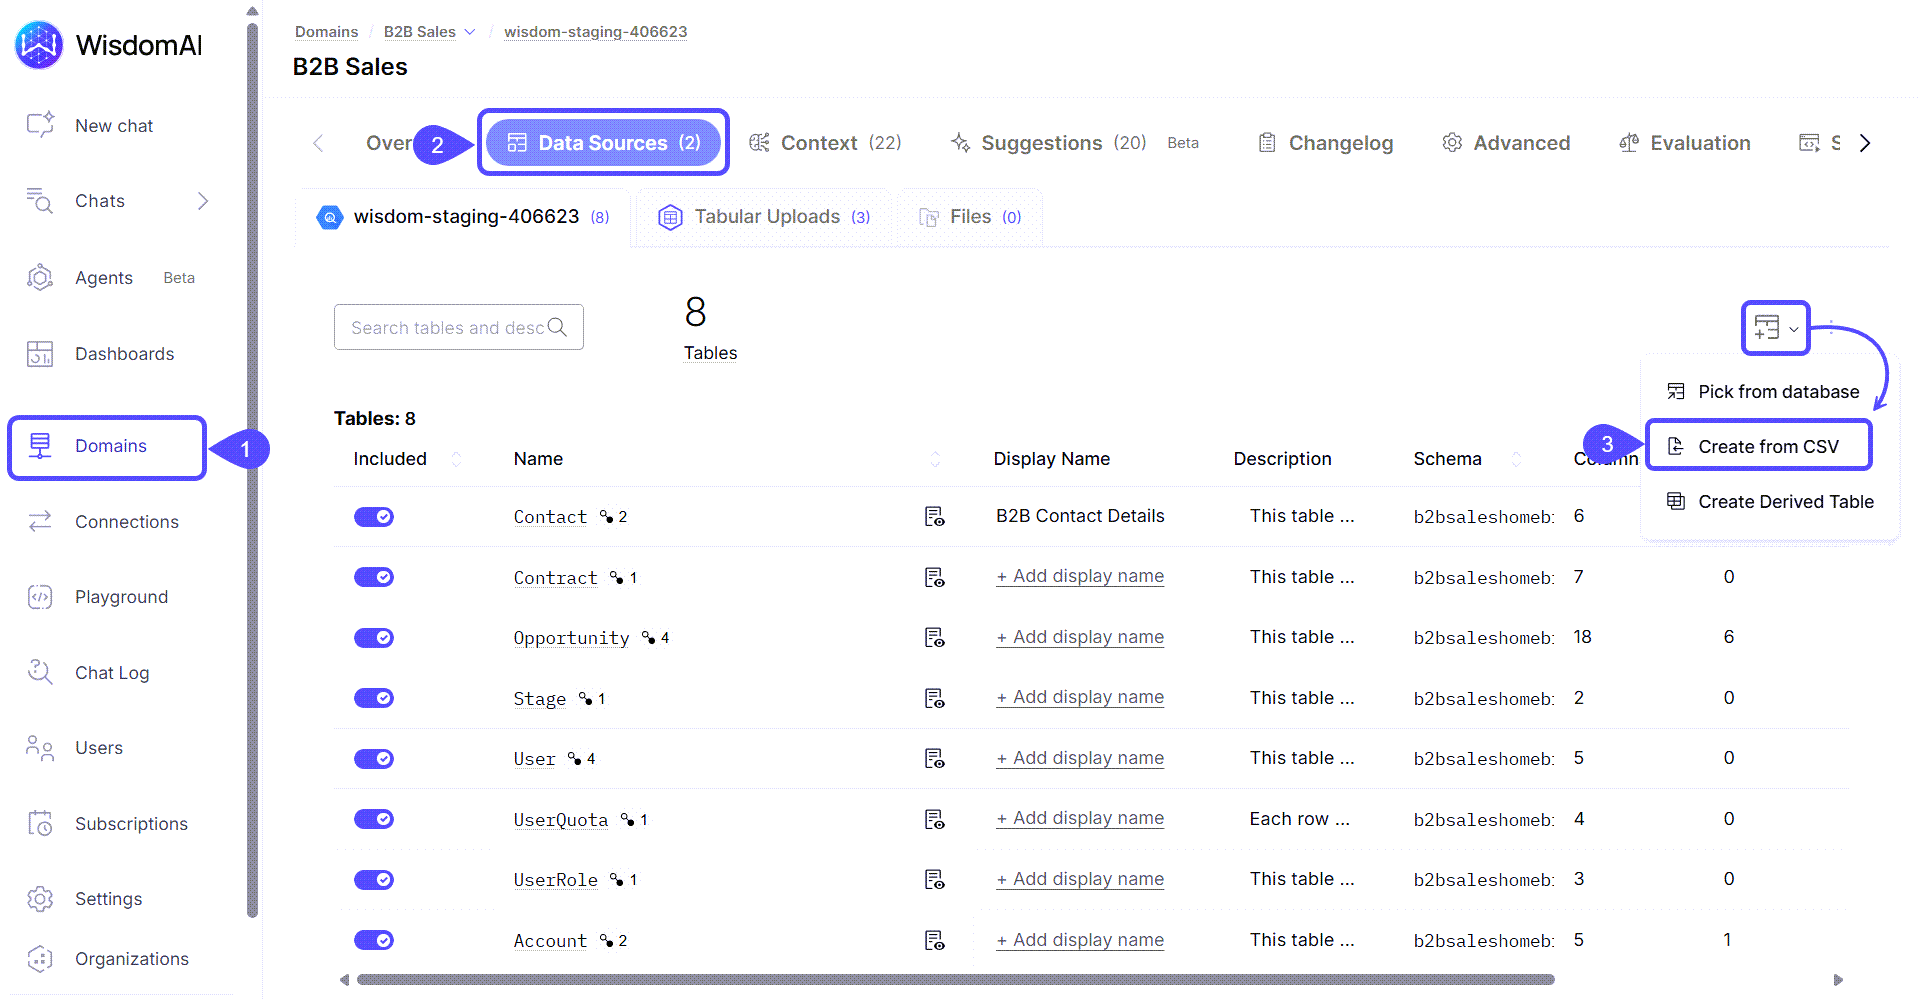
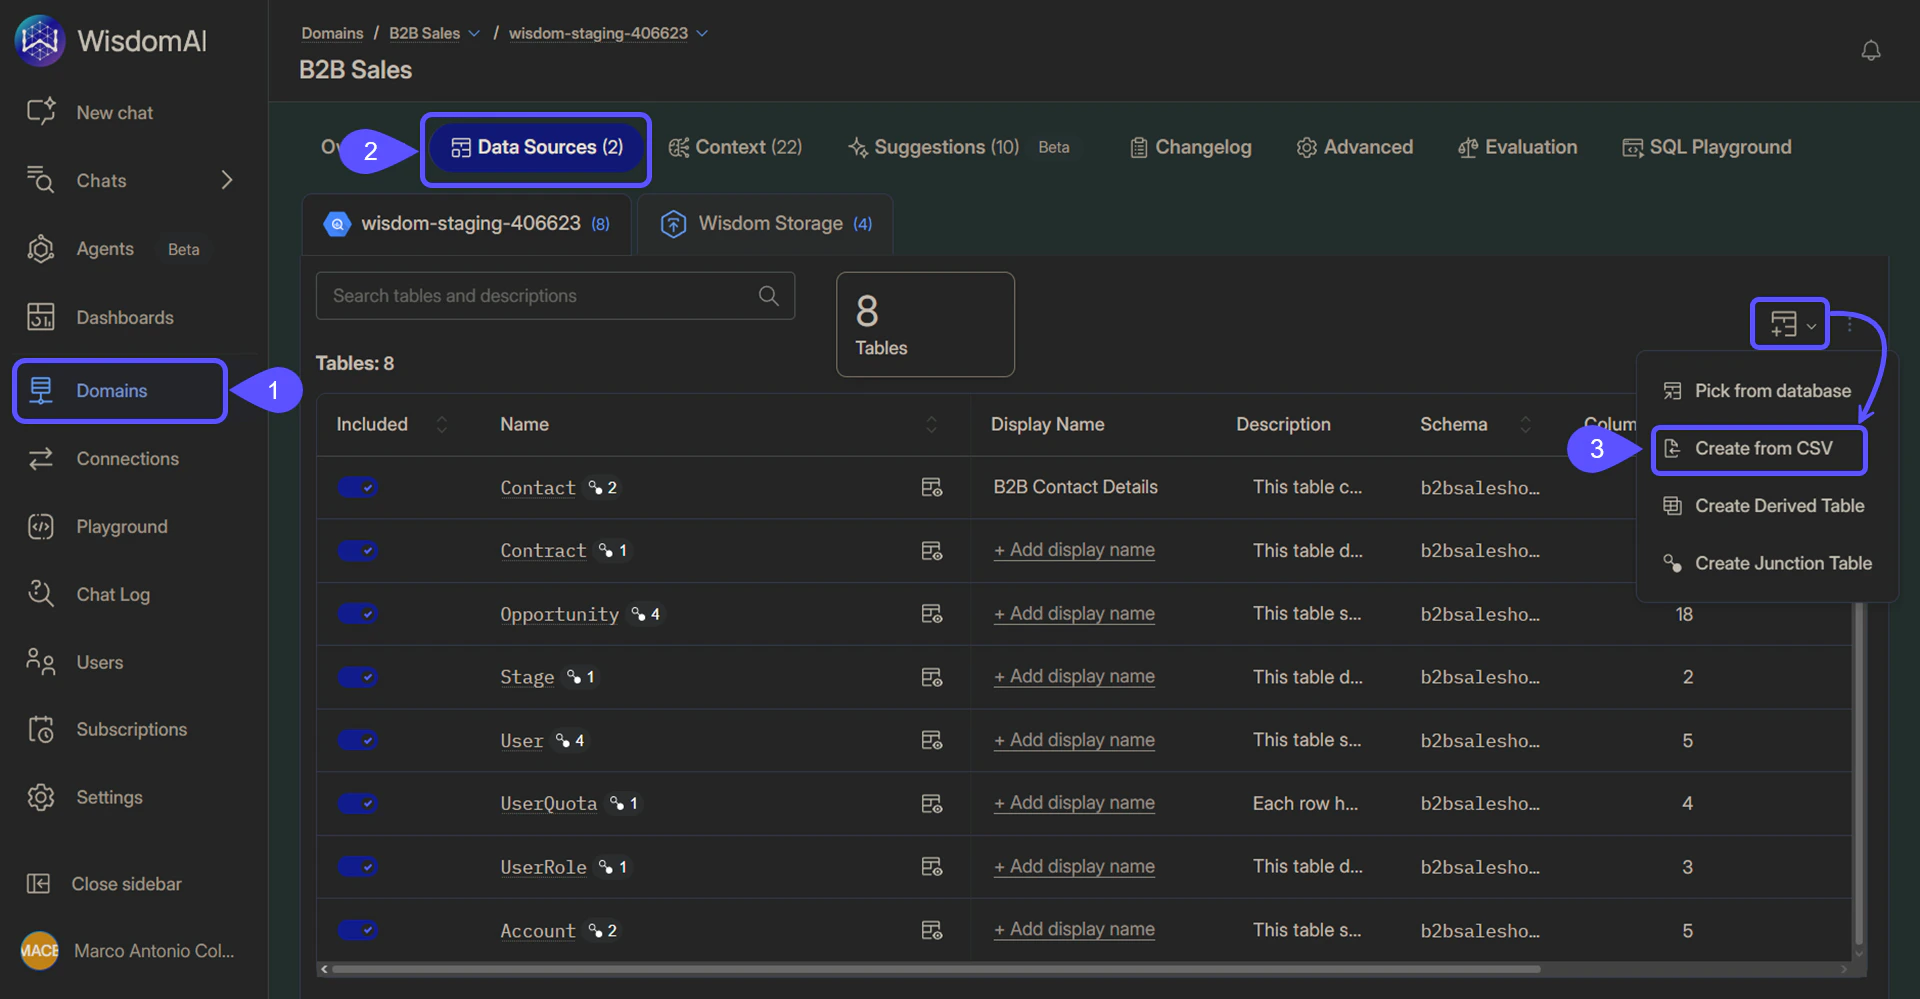
1. Navigate to **Domains** in the left sidebar and select your Domain.
2. Go to the **Data Sources** tab.
3. Click **Add Table** and select **Create from CSV**.
## 3. Upload CSV files (Optional)
In addition to database connections, Admins can add data directly to a Domain using CSV, TSV, or Excel files. When an Admin adds a file this way, the data becomes a permanent part of the Domain and is available to all users with access to that Domain.
1. Navigate to **Domains** in the left sidebar and select your Domain.
2. Go to the **Data Sources** tab.
3. Click **Add Table** and select **Create from CSV**.
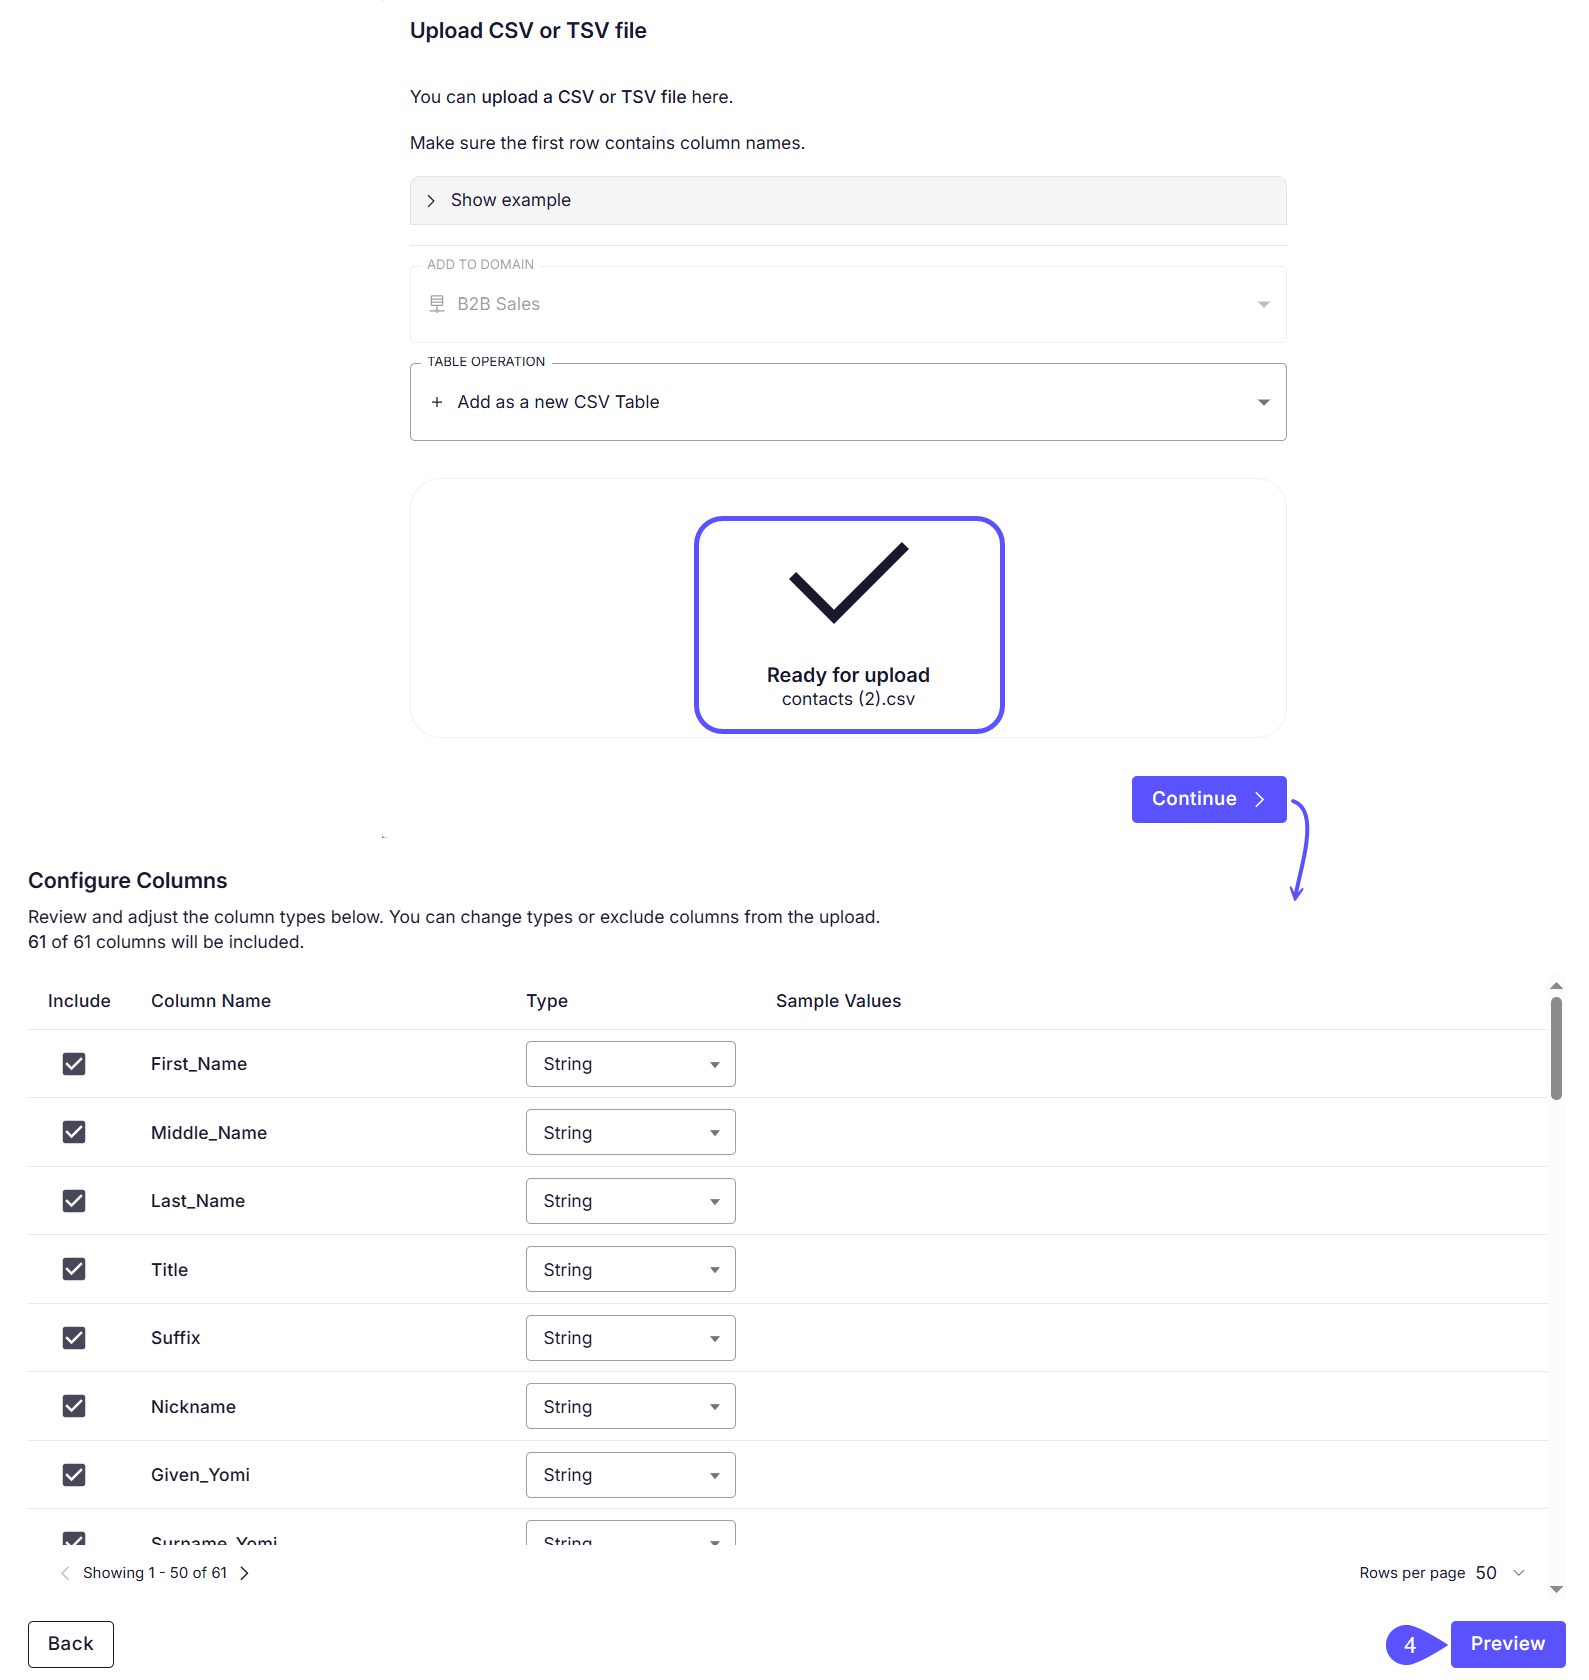
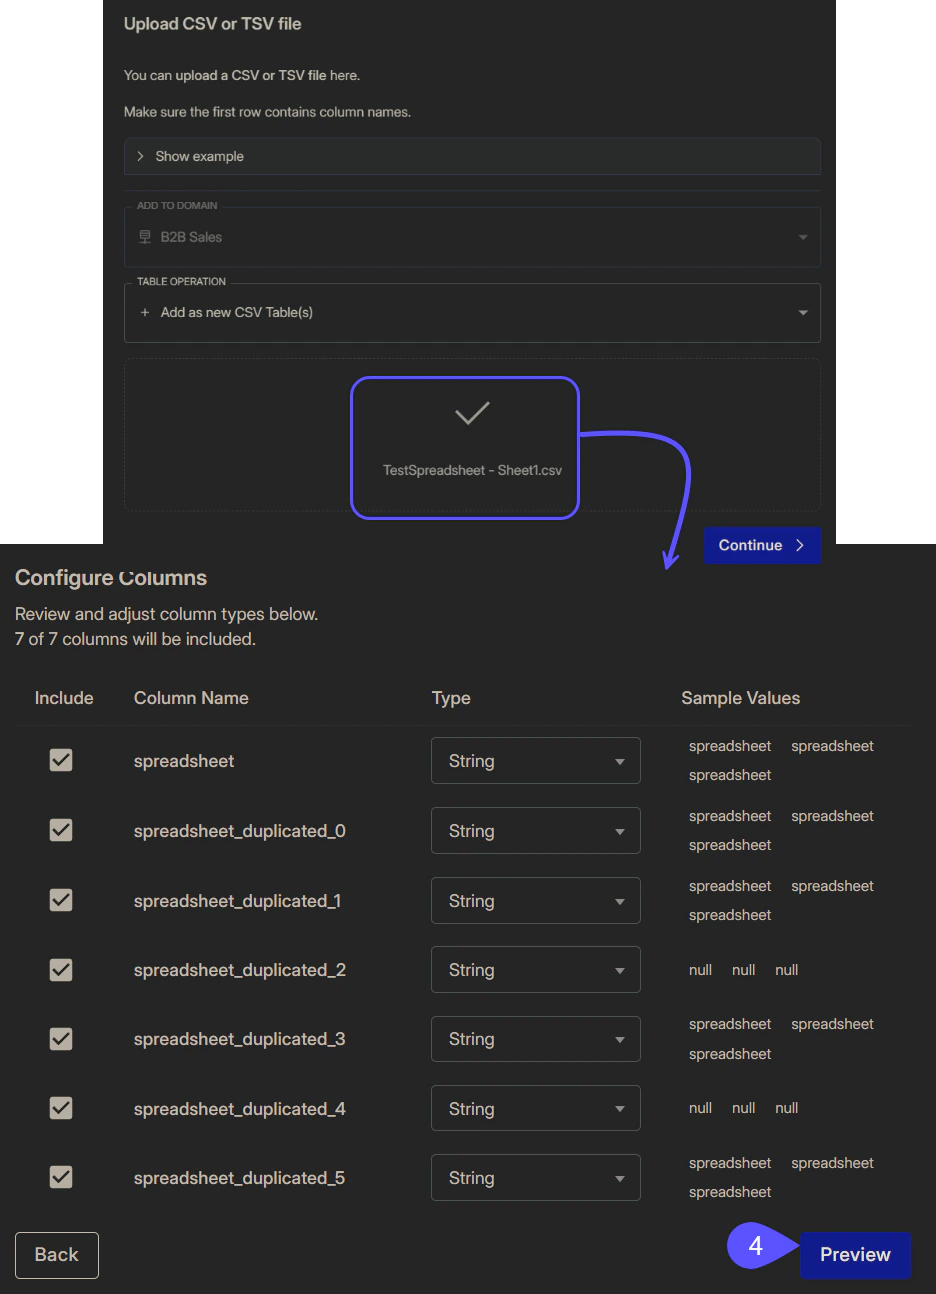
 4. Upload your file and configure the column types.
 **Replace an Existing Table**
You can also replace an existing CSV table instead of uploading a new one. This allows you to update the underlying data while preserving all existing column descriptions, settings, and domain configurations. To learn how to do it, see our [Work with CSV Files](/using-wisdom-ai-everyday/work-with-csv-files) guide.
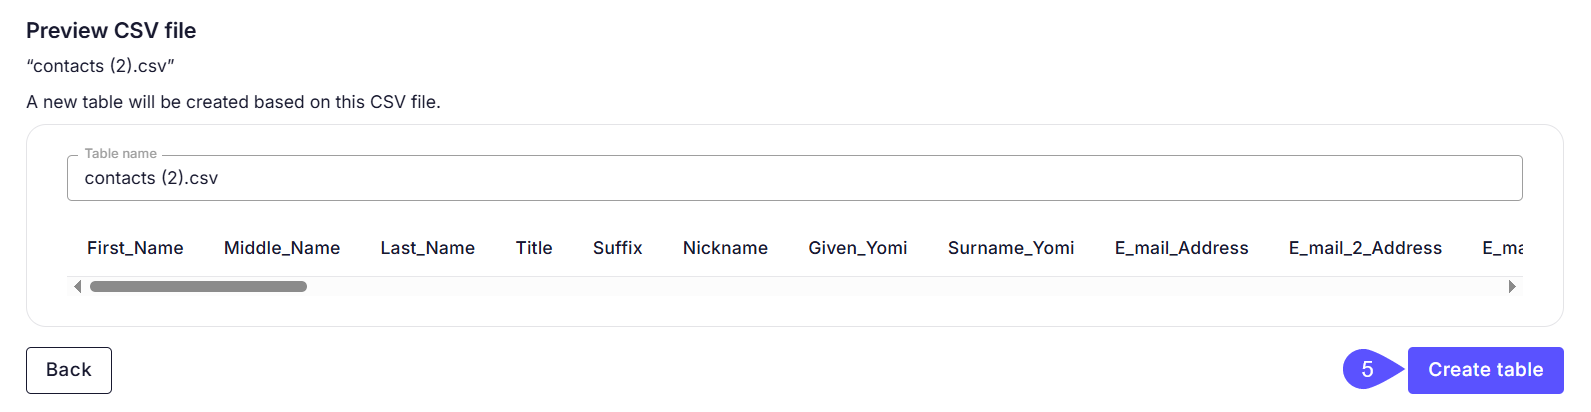
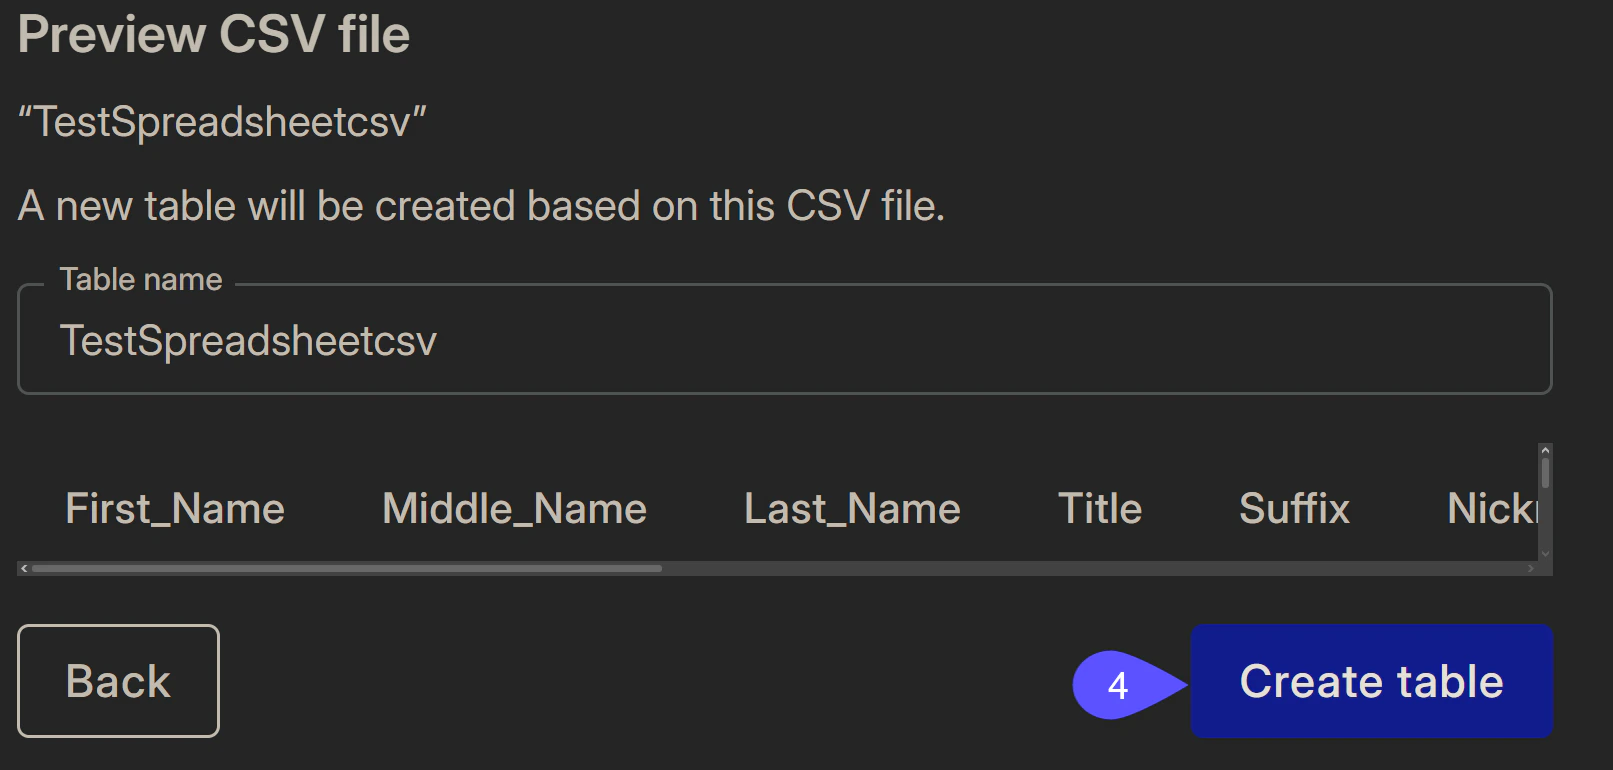
5. Click **Create table**.
**Replace an Existing Table**
You can also replace an existing CSV table instead of uploading a new one. This allows you to update the underlying data while preserving all existing column descriptions, settings, and domain configurations. To learn how to do it, see our [Work with CSV Files](/using-wisdom-ai-everyday/work-with-csv-files) guide.
5. Click **Create table**.
 **Use CSVs as an Explorer**
WisdomAI also allows non-admin users to create private domains or attach CSVs directly to a chat for quick analysis. For a full breakdown of these features and detailed configuration steps, see our [Work with CSV Files](/using-wisdom-ai-everyday/work-with-csv-files) guide.
## 4. Start testing
Once your data is set up and selected, you can start querying your data to see WisdomAI in action and test its data analysis capabilities. Here are some example questions you may ask:
* *"What was our revenue by region last quarter?"*
* *"Show me customer retention by month."*
* *"Which products had the highest growth rate compared to last year?"*
While experimenting with your AI data analyst, you can **train** it by providing **feedback**. There are three main ways to do so:
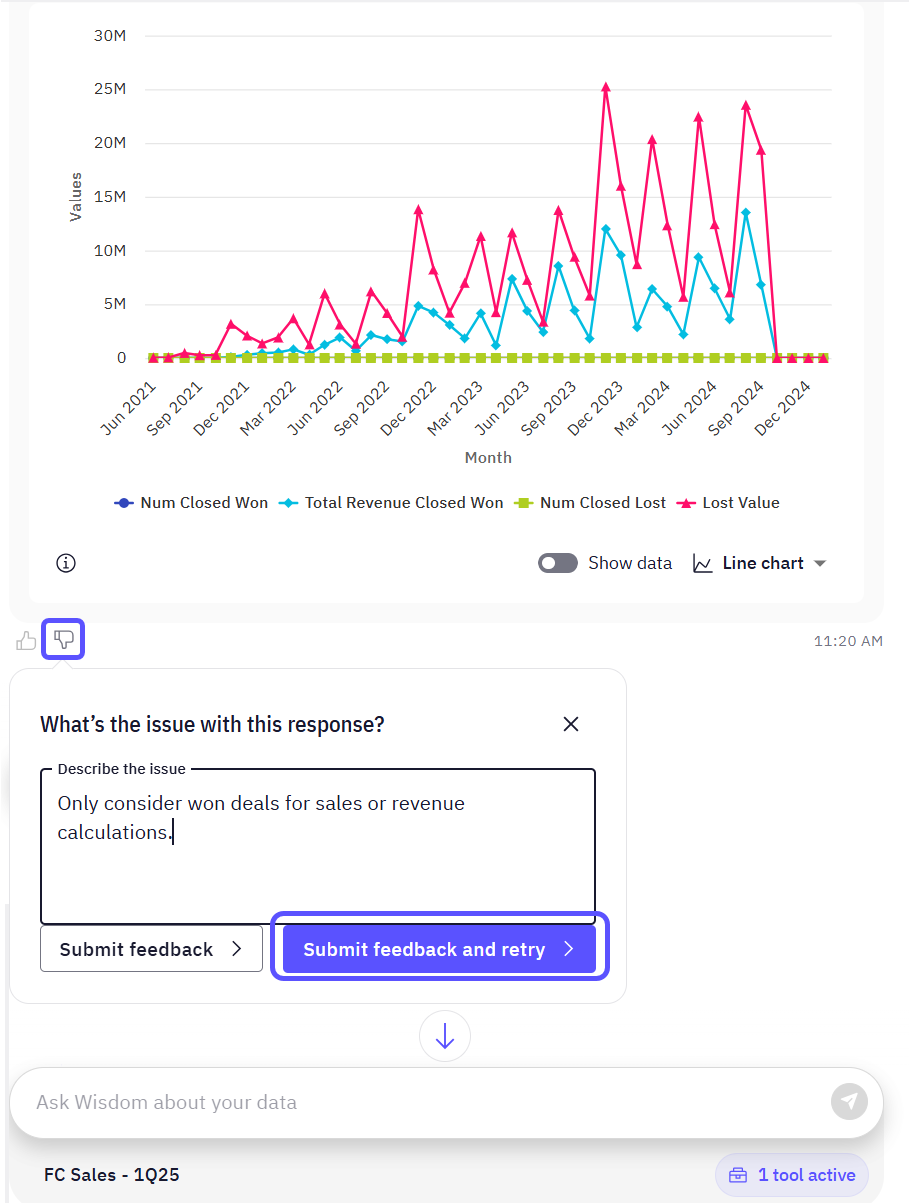
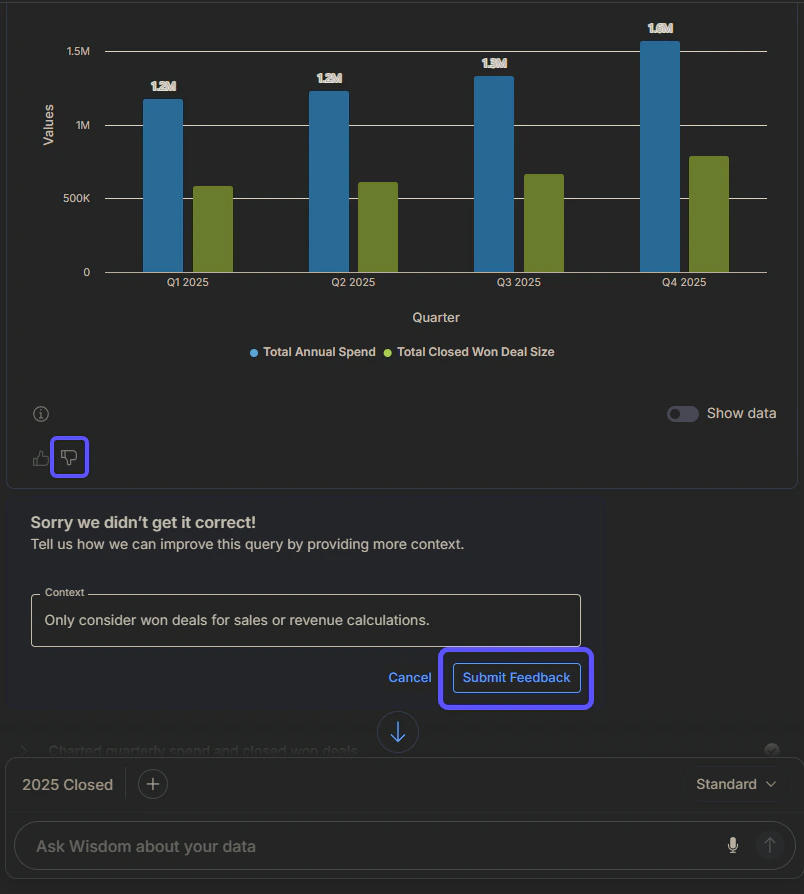
* Using the **thumbs up/down** icons. If your feedback was thumbs down, a new window opens so you can adjust the query accordingly. The more thumbs up/down you provide, the more you will train the tool to get high-quality, correct answers.
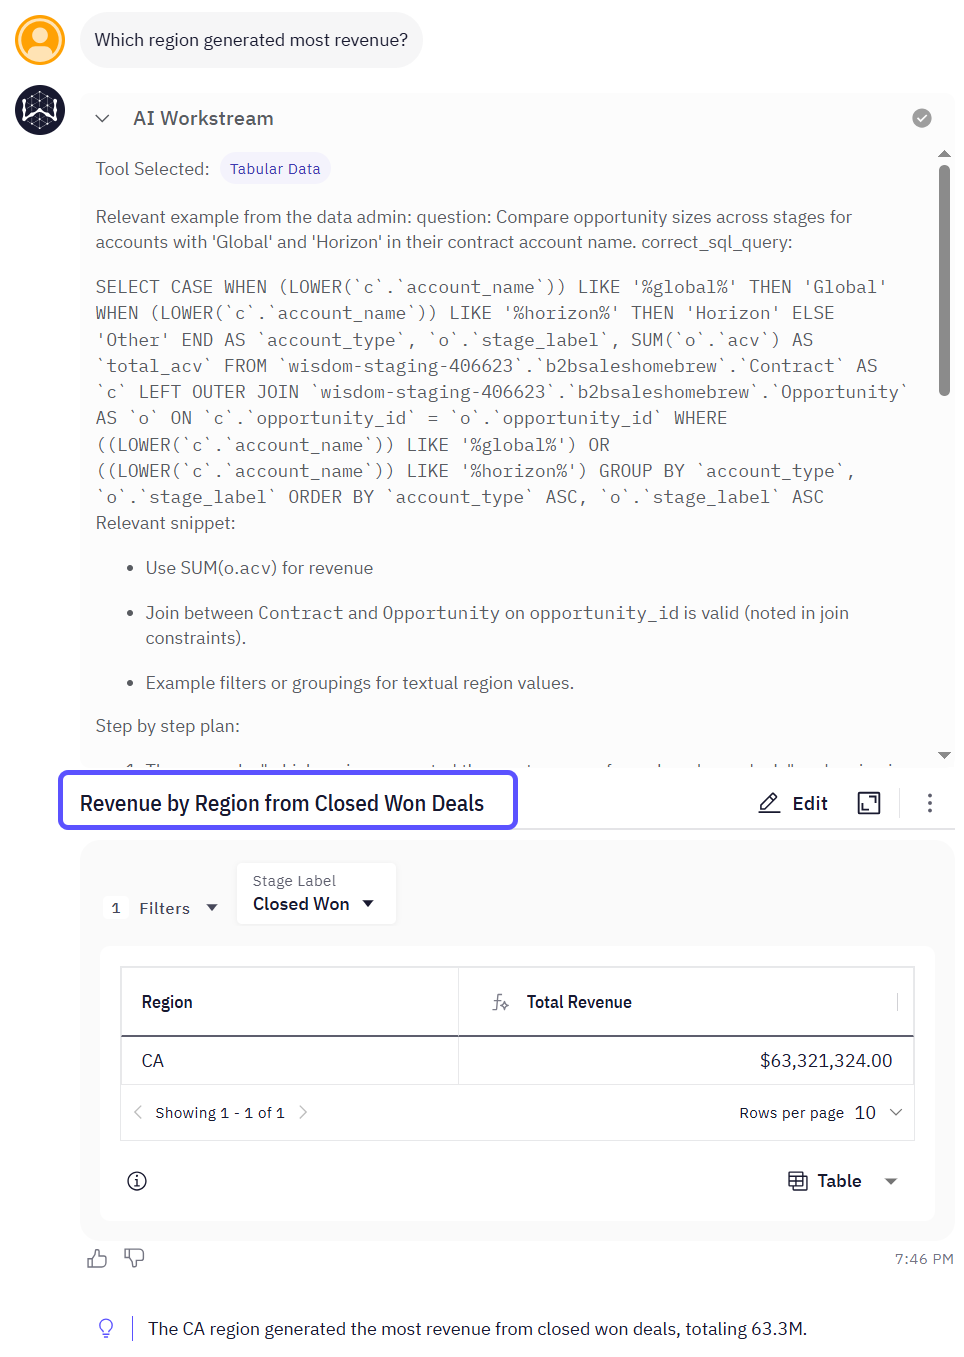
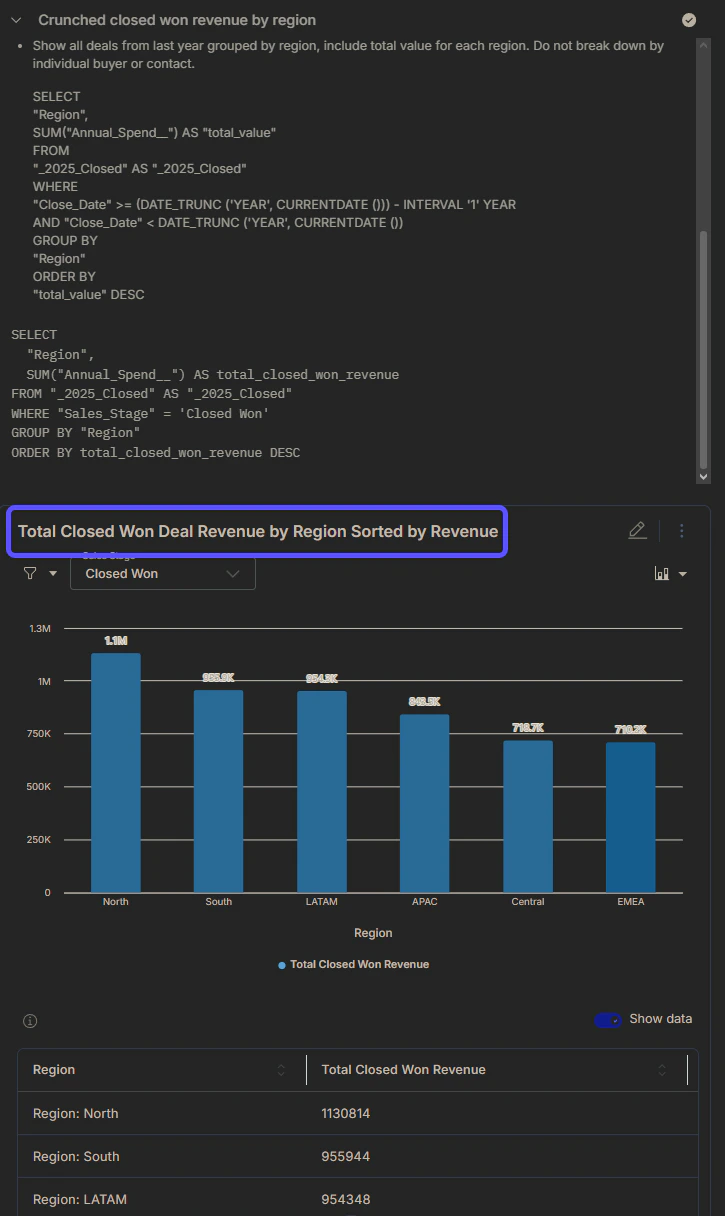
* By **changing the SQL Code**.
* By **Fine-tuning** the **Knowledge**.
Think about the following scenario: you tell the system that the Report it created is incorrect, so you provide the accurate data in the chat. If this additional context has not been added to the database tables, you can add it directly in the chat.
In all these cases, the system will use the provided data to further refine the context of your database, enabling it to provide better answers in future searches, as shown in the example images below.
**Use CSVs as an Explorer**
WisdomAI also allows non-admin users to create private domains or attach CSVs directly to a chat for quick analysis. For a full breakdown of these features and detailed configuration steps, see our [Work with CSV Files](/using-wisdom-ai-everyday/work-with-csv-files) guide.
## 4. Start testing
Once your data is set up and selected, you can start querying your data to see WisdomAI in action and test its data analysis capabilities. Here are some example questions you may ask:
* *"What was our revenue by region last quarter?"*
* *"Show me customer retention by month."*
* *"Which products had the highest growth rate compared to last year?"*
While experimenting with your AI data analyst, you can **train** it by providing **feedback**. There are three main ways to do so:
* Using the **thumbs up/down** icons. If your feedback was thumbs down, a new window opens so you can adjust the query accordingly. The more thumbs up/down you provide, the more you will train the tool to get high-quality, correct answers.
* By **changing the SQL Code**.
* By **Fine-tuning** the **Knowledge**.
Think about the following scenario: you tell the system that the Report it created is incorrect, so you provide the accurate data in the chat. If this additional context has not been added to the database tables, you can add it directly in the chat.
In all these cases, the system will use the provided data to further refine the context of your database, enabling it to provide better answers in future searches, as shown in the example images below.
 Currently, feedback icons (thumbs-up and thumbs-down) appear only for responses containing charts or structured data. Feedback for text-only responses is not yet supported, but will be available in a future update.
## Next steps
Explore the full list of databases and platforms you can connect to the system.
Define relationships and context in your data to enable more powerful analysis.
Learn how to rate answers and provide corrections to improve the system's accuracy.
4. Upload your file and configure the column types.
**Replace an Existing Table**
You can also replace an existing CSV table instead of uploading a new one. This allows you to update the underlying data while preserving all existing column descriptions, settings, and domain configurations. To learn how to do it, see our [Work with CSV Files](/using-wisdom-ai-everyday/work-with-csv-files) guide.
5. Click **Create table**.
**Use CSVs as an Explorer**
WisdomAI also allows non-admin users to create private domains or attach CSVs directly to a chat for quick analysis. For a full breakdown of these features and detailed configuration steps, see our [Work with CSV Files](/using-wisdom-ai-everyday/work-with-csv-files) guide.
## Start testing
Once your data is set up and selected, you can begin experimenting with your WisdomAI chatbot to see it in action and test its data analysis capabilities. Here are some example questions you may ask:
* *"What was our revenue by region last quarter?"*
* *"Show me customer retention by month."*
* *"Which products had the highest growth rate compared to last year?"*
While experimenting with your chatbot, you can **train** it by providing **feedback**. There are three main ways to do so:
* Using the **thumbs up/down** icons. If your feedback was thumbs down, a new window opens so you can adjust the query accordingly. The more thumbs up/down you provide, the more you will train the tool to get high-quality, correct answers.
* By **changing the SQL Code**.
* By **Fine-tuning** the **Knowledge**.
Think about the following scenario: you tell the system that the Report it created is incorrect, so you provide the accurate data in the chat. If this additional context has not been added to the database tables, you can add it directly in the chat.
In all these cases, the system will use the provided data to further refine the context of your database, enabling it to provide better answers in future searches, as shown in the example images below.
## 4. Start testing
Once your data is set up and selected, you can start querying your data to see WisdomAI in action and test its data analysis capabilities. Here are some example questions you may ask:
While experimenting with your AI data analyst, you can **train** it by providing **feedback**. There are three main ways to do so:
Currently, feedback icons (thumbs-up and thumbs-down) appear only for responses containing charts or structured data. Feedback for text-only responses is not yet supported, but will be available in a future update.
## Next steps
Explore the full list of databases and platforms you can connect to the system.
Define relationships and context in your data to enable more powerful analysis.
Learn how to rate answers and provide corrections to improve the system's accuracy.
4. Upload your file and configure the column types.
**Replace an Existing Table**
You can also replace an existing CSV table instead of uploading a new one. This allows you to update the underlying data while preserving all existing column descriptions, settings, and domain configurations. To learn how to do it, see our [Work with CSV Files](/using-wisdom-ai-everyday/work-with-csv-files) guide.
5. Click **Create table**.
**Use CSVs as an Explorer**
WisdomAI also allows non-admin users to create private domains or attach CSVs directly to a chat for quick analysis. For a full breakdown of these features and detailed configuration steps, see our [Work with CSV Files](/using-wisdom-ai-everyday/work-with-csv-files) guide.
## Start testing
Once your data is set up and selected, you can begin experimenting with your WisdomAI chatbot to see it in action and test its data analysis capabilities. Here are some example questions you may ask:
* *"What was our revenue by region last quarter?"*
* *"Show me customer retention by month."*
* *"Which products had the highest growth rate compared to last year?"*
While experimenting with your chatbot, you can **train** it by providing **feedback**. There are three main ways to do so:
* Using the **thumbs up/down** icons. If your feedback was thumbs down, a new window opens so you can adjust the query accordingly. The more thumbs up/down you provide, the more you will train the tool to get high-quality, correct answers.
* By **changing the SQL Code**.
* By **Fine-tuning** the **Knowledge**.
Think about the following scenario: you tell the system that the Report it created is incorrect, so you provide the accurate data in the chat. If this additional context has not been added to the database tables, you can add it directly in the chat.
In all these cases, the system will use the provided data to further refine the context of your database, enabling it to provide better answers in future searches, as shown in the example images below.
## 4. Start testing
Once your data is set up and selected, you can start querying your data to see WisdomAI in action and test its data analysis capabilities. Here are some example questions you may ask:
While experimenting with your AI data analyst, you can **train** it by providing **feedback**. There are three main ways to do so: